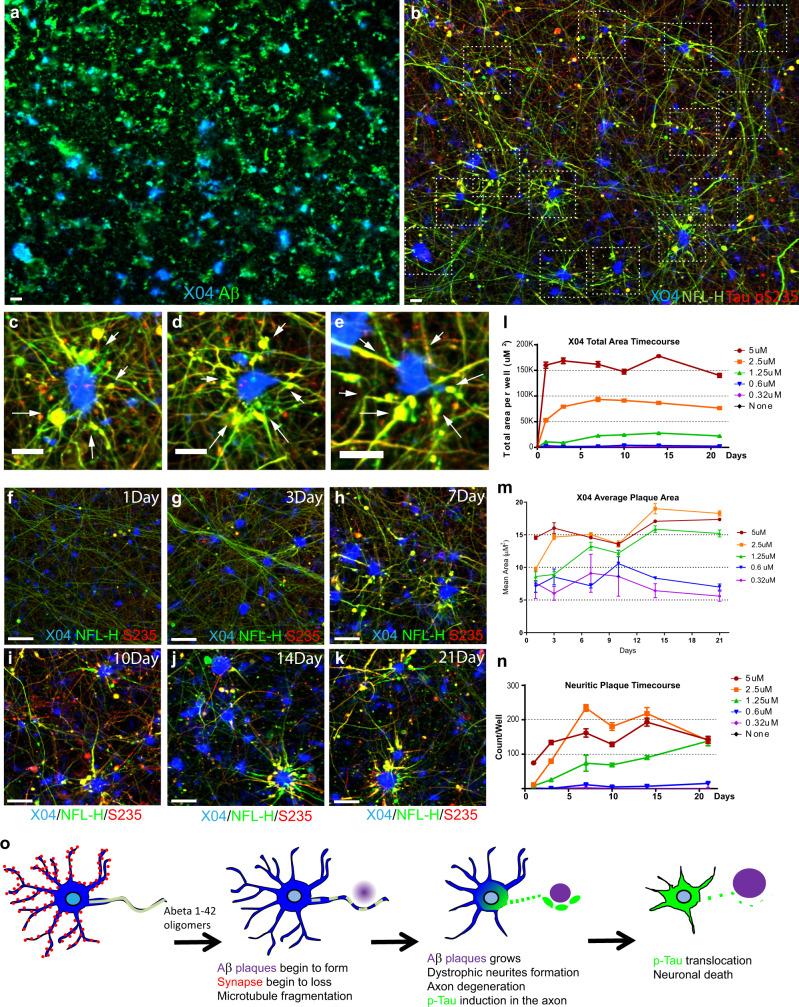
Fig. 3. Human iPSC neurons form Aβ plaques that are surrounded by dystrophic neurites.
a, b iPSC-derived neurons and primary astrocytes were treated with 2.5 μM sAβ42s for 7 days and stained for Aβ-plaque structures (a) (Methoxy-X04; blue), 6E10 (Aβ; green) (b) axons (NFL-H; green), and p-Tau (S235; red). b Neuritic plaques are indicated by dotted white boxes. c–e Zoomed-in images of B showing axonal swelling (NFL-H; green) and p-Tau induction (S235; red) in axons around Aβ-plaque structures (Methoxy-X04; blue). f–k Neurons were treated with 2.5 μM sAβ42s and analyzed over a 21-day time course for axonal fragmentation (NFL-H; green), p-Tau induction (S235; red), and plaque formation (Methoxy-X04; blue). Dystrophic neurites composed of NFL-H and p-Tau swellings surrounding X04-positive Aβ-plaques were observed. l, m sAβ42s were added to neuronal cultures at concentrations of 5 μM (red), 2.5 μM (orange), 1.25 μM (green), 0.6 μM (blue), and 0.32 μM (purple) on day 0, and neurons were subsequently fixed at day 1, 3, 7, 10, 14, and 21 and stained for various markers. Plaque formation (methoxy-X04-dye-positive regions) begins early after Aβ oligomer treatment and total plaque area (l) increases with high Aβ oligomer concentrations over time and reached maximum area at 7 days. m Average plaque area follows a similar trend, where average plaque size increased to around 15–20 μm and stabilized. n Neurons exhibit dystrophic neurite formation (measured by S235 p-Tau and NFL-H positive axon area) and these neuritic plaques increases in number with high Aβ oligomer concentrations and over time. o Schematic showing a summary of the observed sequential events of neurodegeneration, plaque, and dystrophic neurite formation. Data are presented as mean values +/− SEM and n = 4 wells. All scale bars = 50 μm.

