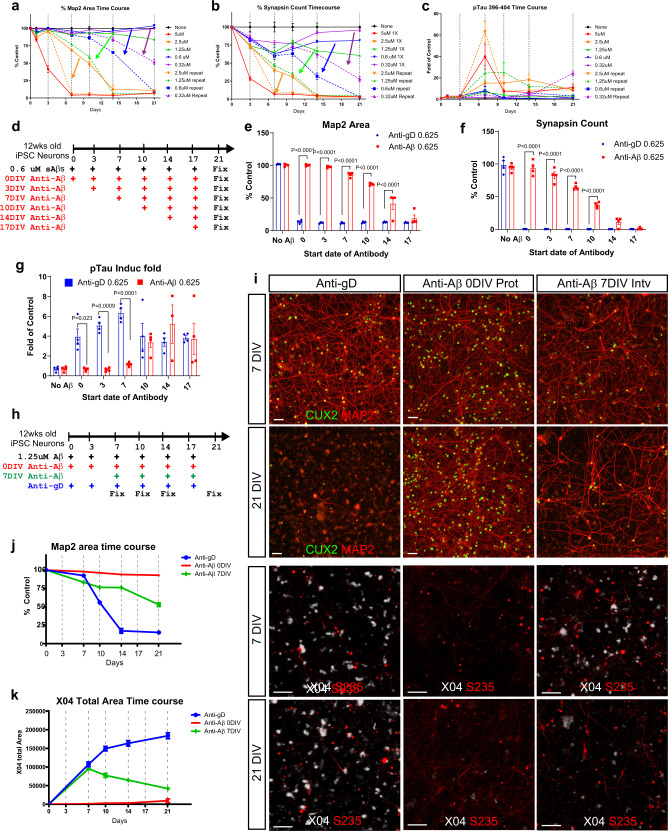
Fig. 7. An early window of efficacy for anti-Aβ antibody revealed by disease progression modeling.
a–c Time-course comparison of 12-week-old iPSC neurons treated with a single dose of sAβ42s (solid lines) versus repeated dose of sAβ42s at the same concentration (dotted lines) at the indicated concentration. MAP2 area (a), Synapse count (b), and p-Tau 396–404 induction fold (c) were quantified. d Repeated dosing schedule of 12-week-old neuron with 0.6 μM of Aβ. Anti-Aβ antibodies dosing regimen was started at indicated time point. All cells were treated in the same plate and fixed at 21 days post first dose. MAP2 area (e), synapsin count (f), and p-Tau induction fold (g) were quantified. Anti-gD antibodies were dosed similarly as control (blue bars) along with anti-Aβ antibody (red bar). h Time-course study design of Anti-Aβ antibodies repeated dosing. sAβ42s are added at every indicated timepoints. Anti-Aβ antibodies were added at day 0 (red) as a protection model or at day 7 (green) as an intervention model. Anti-gD antibodies were used as control (blue). i Representative images from the indicated experimental treatments. Neurons were stained for dendrite marker MAP2 (red) and nuclear marker CUX2 (green) at 7DIV and 21DIV. The lower panel shows Aβ plaque staining (X04, white) and p-Tau S235 (red) staining. Quantification of MAP2 area over time (j) and plaque area (k) illustrated that the anti-Aβ intervention model is capable of slowing down neuron degeneration and plaque formation. Scale bars = 50 μm. Data are presented as mean values +/− SEM and n = 4 wells. Two-way ANOVA with Tukey’s multiple comparisons test.

