Figure 2.
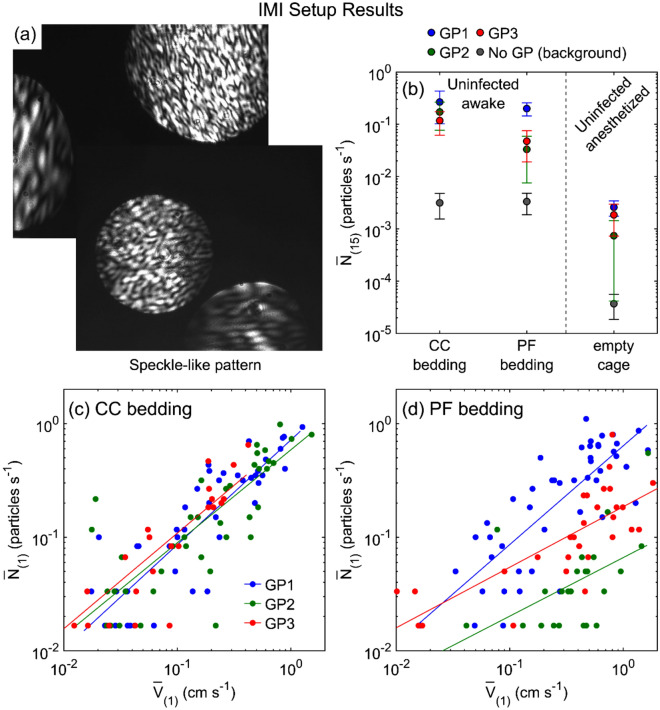
Particle emission rates measured by IMI setup. (a) Images captured by CCD camera that show speckle-like pattern for particles illuminated by the laser sheet. (b) Time-averaged particle emission rate, for three guinea pigs (GP1, GP2, and GP3) under different conditions: uninfected, awake guinea pig in the cage with CC bedding or PF bedding, and uninfected, anesthetized guinea pig inside the empty cage. A plastic bag was used to cover anesthetized guinea pig fur with a small opening for its nose facing directly toward the laser sheet. Background particle measurements for each condition where no guinea pig was in the cage are shown with gray circle markers (No GP (background)). Each data point is the average of four 15-min time-averaged particle emission rates and 3 trials for each guinea pig. Time-averaged particle emission rate, versus time-averaged guinea pig movement velocity, over 1 min, for three uninfected guinea pigs in the cage with (c) CC bedding, and (d) PF bedding. Solid lines are best power law fits (see Table S1 for statistics).

