Figure 3.
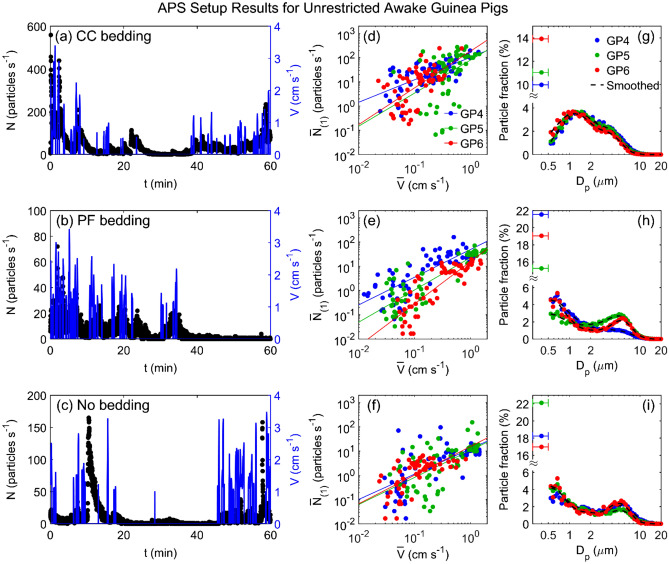
Particle emission rates measured by APS setup for unrestricted awake guinea pigs. Particle emission rate, (left axis) and guinea pig movement velocity, (right axis) versus time for a representative guinea pig in the cage with (a) CC bedding, (b) PF bedding, and (c) no bedding. Time-averaged particle emission rate, versus time-averaged guinea pig movement velocity, , for three uninfected awake guinea pigs (GP4, GP5, and GP6) in the cage with (d) CC bedding, (e) PF bedding, and (f) no bedding. Solid lines are power law fits (see Table S2 for statistics). Corresponding size distributions (g, h, and i) for the uninfected awake guinea pigs (GP4, GP5, and GP6) in the cage with (g) CC bedding, (h) PF bedding, and (i) no bedding. The left-most data points in each plot shows the fraction of particles counted in the 0.3–0.5 μm bin, which cannot be further size-discriminated. The whiskers represent the width of the bin (0.3–0.5 μm). Dashed lines represent the data using a 5-point smoothing function. Data indicated by blue markers for GP4 in (d) and (g) are reproduced from Asadi et al.24 and included here for comparison.

