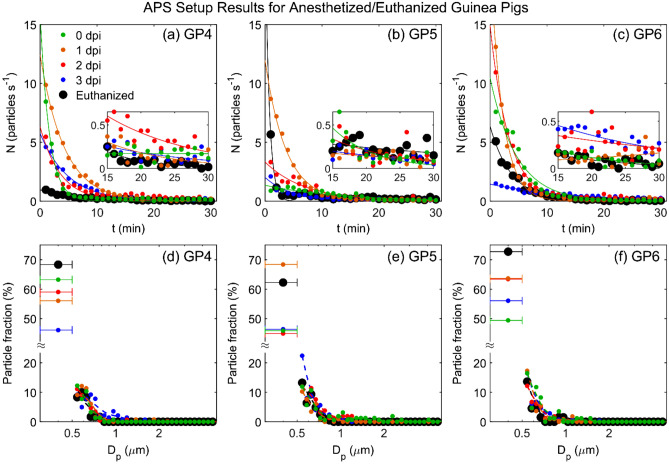
Figure 4.
Particle emission from anesthetized or euthanized guinea pigs measured by the APS setup. Particle emission rate, , versus time under 5 conditions: uninfected anesthetized guinea pig (0 dpi), inoculated anesthetized guinea pig at 1, 2, and 3 dpi, and euthanized guinea pig, for (a) GP4, (b) GP5, and (c) GP6. Magnifications show the final 15 min of each set. (d–f) Corresponding size distribution for particles emitted during the last 15 min of the measurements shown in (a)–(c). The left-most data points in each plot shows the fraction of particles counted in the 0.3–0.5 μm bin, which cannot be further size-discriminated. The whiskers represent the width of the bin (0.3–0.5 μm). Dashed lines represent the data using a 5-point smoothing function. Data indicated by red and black markers in (d) for GP4 at 2 dpi and euthanized, respectively, are reproduced from Asadi et al.24 and included here for comparison.

