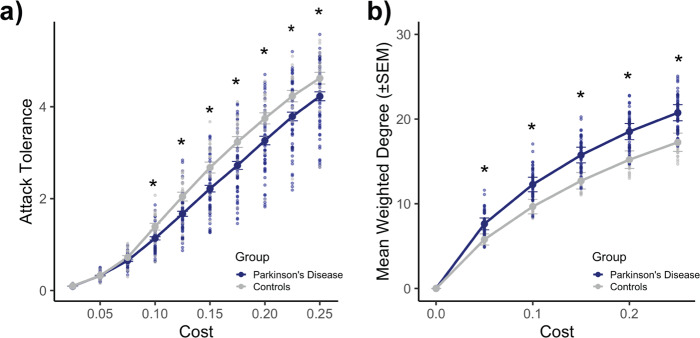
Fig. 4. Parkinson’s disease vs. control group comparisons of attack tolerance and weighted degree of the frontoparietal network.
All analyses were performed on thresholded matrices. a Targeted-attack analysis. The PD group displayed significantly reduced attack tolerance relative to the healthy control group across seven of the 10 costs examined (random-permutation test, p-values > 0.08 for costs 2.5–7.5%; otherwise, p-values < 0.03). b Mean (±SEM) weighted degree of nodes within the frontoparietal network. The control group displayed significantly reduced weighted degree across all of the valid costs examined (random-permutation test, all p-values < 0.0002). Comparisons reported here are between n = 59 individuals with PD and n = 21 controls. See Supplementary Tables 11 and 13 for complete summaries of statistics.

