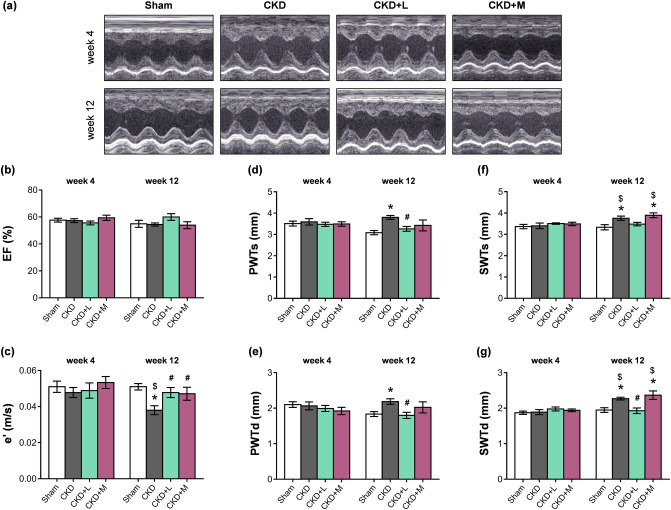
Figure 3.
The effects of losartan and mirabegron on the echocardiographic parameters at week 13. (a) Representative M-mode images, (b) ejection fraction (EF), (c) diastolic septal mitral annulus velocity (e'), (d) posterior wall thicknesses in systole (PWTs) and (e) diastole (PWTd), (f) septal wall thickness in systole (SWTs) and (g) diastole (SWTd). Values are presented as mean ± S.E.M., *p < 0.05 vs. sham-operated group, #p < 0.05 vs. CKD group (n = 7–10, One-Way ANOVA, Holm-Sidak post hoc test), $p < 0.05 vs. week 4 in the same group (n = 7–10, Two-ways repeated-measures ANOVA, Holm-Sidak post hoc test). Sham sham-operated group, CKD chronic kidney disease group, CKD + L losartan-treated chronic kidney disease group, CKD + M mirabegron-treated chronic kidney disease group. Representative M-mode images were saved from the EchoPac Dimension v201 software.

