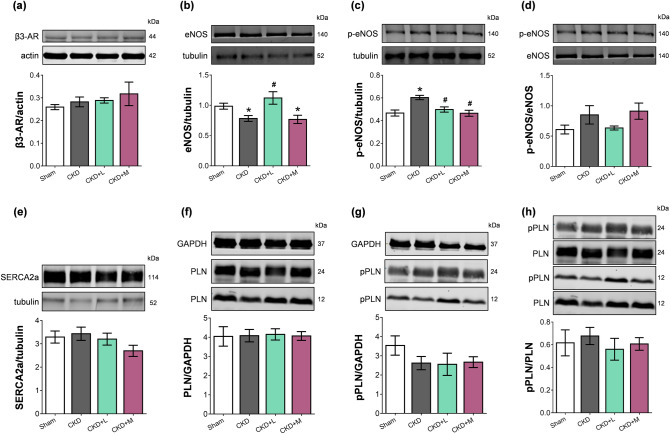
Figure 5.
The effects of losartan and mirabegron on the protein expression at week 13 assessed by Western blot. Left ventricular expression and cropped representative images of (a) beta-3 adrenergic receptor (β3-AR), (b) endothelial nitric oxide synthase (eNOS), (c) phospho-eNOS, (d) phospho-eNOS/ eNOS ratio, (e) sarcoendoplasmic reticulum calcium ATPase 2a (SERCA2a), (f) phospholamban (PLN), (g) phospho-PLN (pPLN), and (h) phospho-PLN/PLN ratio. Values are presented as mean ± S.E.M., *p < 0.05 vs. sham-operated group, #p < 0.05 vs. CKD group (n = 6–7, One-Way ANOVA, Holm-Sidak post hoc test). Sham sham-operated group, CKD chronic kidney disease group, CKD + L losartan-treated chronic kidney disease group, CKD + M mirabegron-treated chronic kidney disease group. Images were captured with the Odyssey CLx machine and exported with Image Studio 5.2.5 software. The full-length Western blots are presented in Supplementary Figures S1-12.

