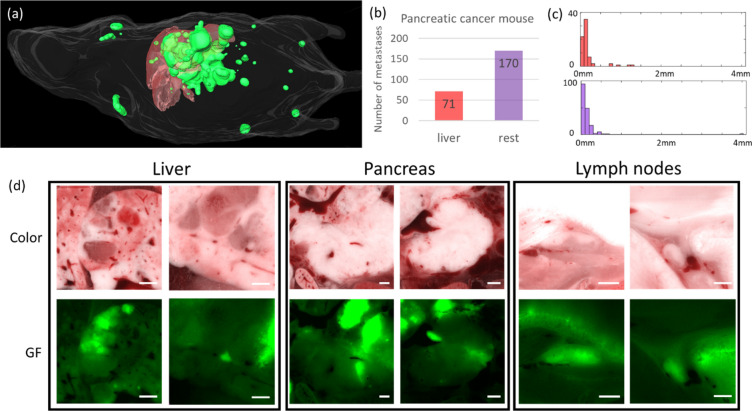
Figure 10.
Assessment of tumor burden in a pancreatic cancer mouse. Three-dimensional volume rendering is shown in (a). Mouse body, liver, and metastases are shown in white, red, and green, respectively. The number of metastases in liver and the rest of the body are shown in (b). The two plots in (c) represent the histogram of radius of metastases in the liver, and the rest of the body with the same colors as the plot in (b). All metastases in the liver are smaller than 1.5 mm, and there is a large metastasis with radius 4.0 mm in the pancreas. Representative metastases in the liver, pancreas, and lymph nodes are shown in (d). For lymph nodes, the left one is the brachial and the right one is the inguinal. Scale bar is 100 µm.

