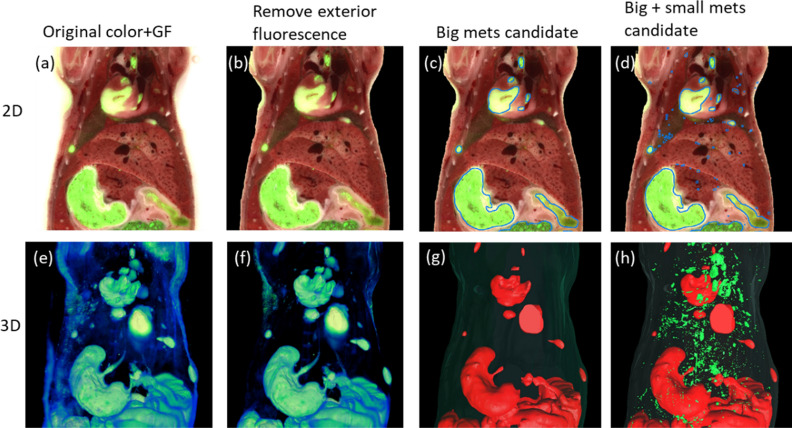
Figure 5.
Workflow and results of metastases candidates segmentation. The first and second row shows 2D images and 3D rendering, respectively, in the abdominal region. The fused color and GF image and the 3D volume rendering of GF image are shown in (a) and (e), respectively. 2D and 3D results after exclusion of exterior fluorescence are shown in (b) and (f), respectively. 2D contouring and 3D surface rendering of the watershed segmented big metastases candidates are shown in (c) and (g), respectively. 2D contouring and 3D surface rendering of segmentation of small metastases candidates are shown in (d) and (h), respectively. There are a lot of FPs from auto-fluorescent structures such as spine, bile duct, lung vessels and airways etc. The segmentation results are input to the CNN classification algorithm.

