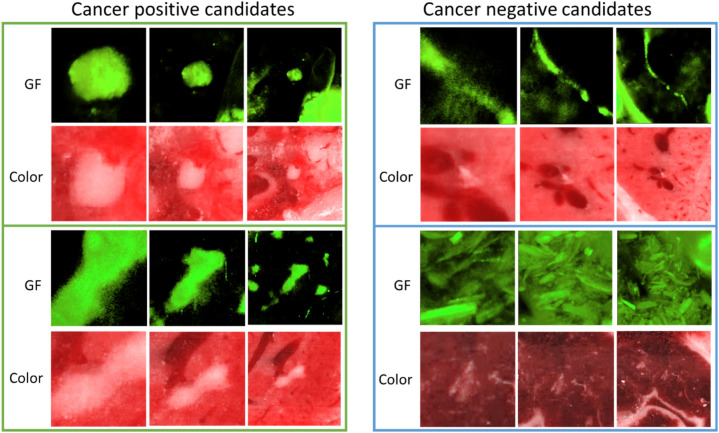
Figure 6.
Representative cancer positive and negative candidates. The input from three scales having different volumes of view are presented in three columns with left to right as 100 × 100 × 12, 200 × 200 × 24, and 400 × 400 × 48. GF images are volume rendered visualizations, and color anatomy images are the central 2D slice from the 3D volume. The two positive candidates are from lung and liver, respectively. The two negative candidates are from bile duct in liver and food remnant in GI tract, respectively.

