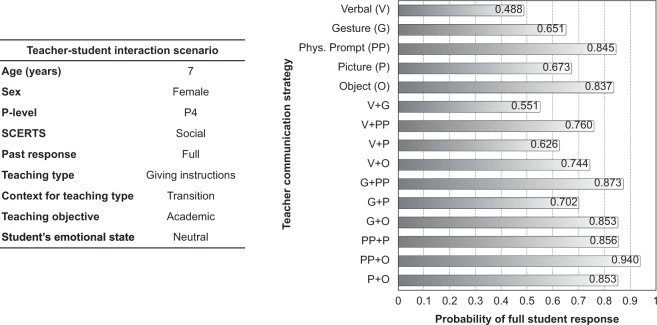
Fig. 2. An example of using the machine learning classifier for predicting the non-calibrated probability that one or more teacher communication strategies would result in a full student response.
The scenario parameters are listed in the table on the left—note that the student profile and the characteristics of this teacher-student interaction are both out-of-sample (i.e. not existent in the collected data). The chart on the right depicts the probabilities of full student response (for the interaction described on the left) for all single teacher communication strategies as well as all possible pairings of them.

