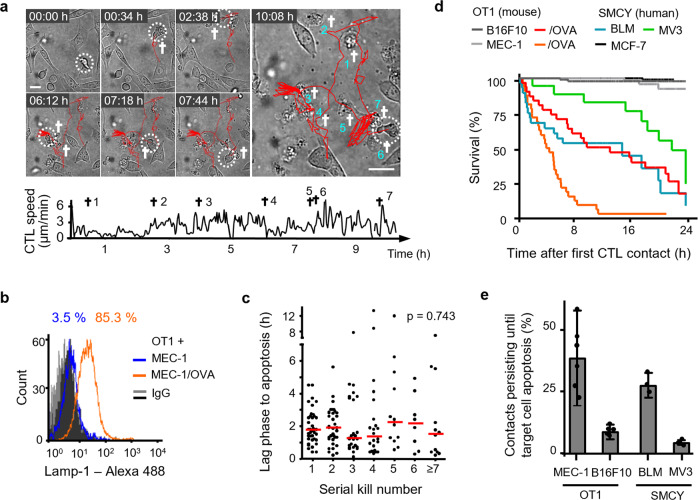
Fig. 1. CTL serial conjugation and effector function in different tumor models.
a Time-lapse sequence and migration track of one OT1 CTL killing seven MEC-1/OVA target cells sequentially within 11 h. Circles, CTL; cross, apoptotic target cell; scale bar, 20 µm. Representative example of a serial killer CTL derived from analysis of 43 CTL pooled from 8 independent experiments). b Lamp-1 expression at the surface of OT1 CTL after 24 h of 3D co-culture with MEC-1/OVA cells. Representative example from three independent experiments. c Lag phase until apoptosis of consecutive single interaction kills by the same CTL (43 CTL from 8 independent experiments). Red bars, median. p-Value, Kruskal–Wallis test. d Population survival of four antigen-dependent mouse and human target, and three control cell lines. Quantifications from three independent experiments for each cell line. B16F10, 98 cells; B16F10/OVA, 31 cells; MEC-1, 57 cells; MEC-1/OVA, 32 cells; BLM, 28 cells; MV3, 18 cells; MCF-7, 102 cells. e Inefficiency of inducing apoptosis by individual CTL contacts in OT1 and SMCY.A2 CTL models. Error bars, mean ± SD obtained from 104 MEC-1/OVA, 183 B16F10/OVA, 53 BLM, and 50 MV3 contacts from N = 5 (MEC-1/OVA, B16F10/OVA) or 3 (BLM, MV3) independent experiments per cell model. Source data are provided as a Source Data file.

