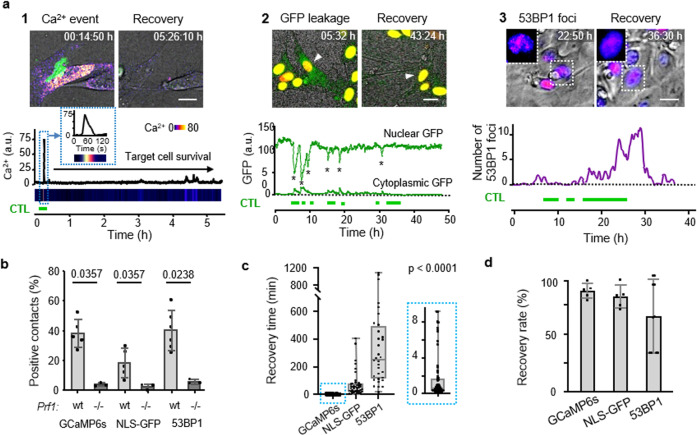
Fig. 2. Type and kinetics of sublethal damage induced by CTL.
a Reporter strategies. Green horizontal bars, duration of CTL contacts. Panel 1: CTL-mediated perforin pores visualized as Ca2+ influx into B16F10/OVA target cells using the GCaMP6s reporter. Time-resolved intensity plot of GCaMP6s event in the target cell cytosol followed by survival. Green, OT1 CTL (GFP); Fire LUT, Ca2+ level (GCaMP6s). Panel 2: CTL-mediated structural damage of the nuclear lamina monitored as NLS-GFP leakage into the cytosol. Nuclear and cytosolic GFP intensity plotted over time. Green, NLS-GFP; red: Histone-2B-mCherry; arrowhead: monitored cell. Asterisks, nuclear leakage events. Panel 3: CTL-mediated DNA damage response plotted as 53BP1trunc-Apple focalization in the nucleus over time. Fire LUT, 53BP1trunc-Apple. Insets, zooms of reversibility of 53BP1 foci. Scale bars, 10 µm. Image sequences in panels 1 and 2 show representative examples from experimental datasets shown in b–d. b Percentage of contacts of wt and perforin-deficient CTL with B16F10/OVA cells inducing Ca2+ events, NLS-GFP cytosolic leakage, and 53BP1trunc-Apple foci in target cells. Data show the mean ± SD from N = 3 (GCaMP6s/wt, NLS-GFP/wt/prf1−/−), 5 (53BP1trunc-Apple/wt), and triplicate movies from 1 (GCaMP6s/prf1−/−, NLS-GFP/prf1−/−) independent experiments. p-Values, two-tailed Mann–Whitney test comparing wt and prf1−/− datasets. c Recovery times from initiation to termination of GCaMP6s, NLS-GFP, and 53BP1trunc-Apple reporter activity. Data show the medians with whiskers from minimum to maximum values derived from N = 32 (53BP1trunc-Apple), 40 (NLS-GFP), and 71 (GCaMP6s) individual events pooled from 3 (NLS-GFP, GCaMP6s) and 5 (53BP1trunc-Apple) independent experiments. p-Value, Kruskal–Wallis test comparing all groups corrected by Dunn’s multiple comparisons test. d Percentage of cells with sublethal damage event, which fully resolved. Data show the mean ± SD (five independent experiments per reporter) for an 1:2 ET ratio. Source data are provided as a Source Data file.

