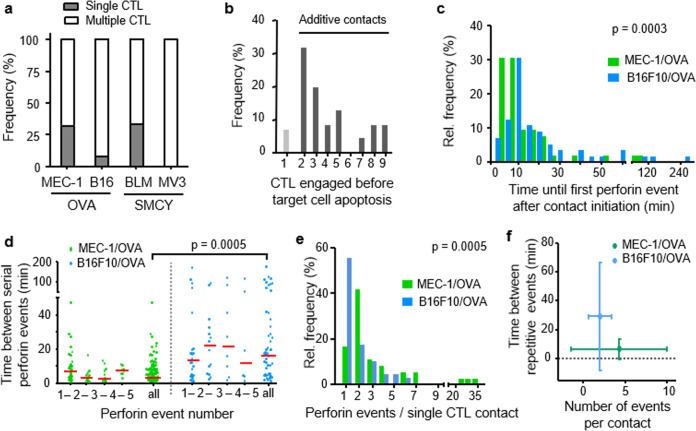
Fig. 4. Kinetics and frequency of CTL-induced sublethal events.
a Percentage of apoptosis events preceded by multiple or single CTL contacts in mouse and human melanoma models. Pooled data representing ≥100 contacts from ≥3 independent experiments per cell line. b Percentage of CTL engaged before target cell death in B16F10/OVA co-culture with OT1 CTL. c Lag phase until first Ca2+ event after contact initiation in MEC-1/OVA and B16F10/OVA target cells. Data from 55 (B16F10) and 52 (MEC-1) Ca2+ events. p-Value, two-tailed Mann–Whitney test. d Intervals between sequential Ca2+ events in the target cell induced by the same CTL in one single contact. Medians were 4 min (MEC-1/OVA) and 18 min (B16F10/OVA). Red line, median. Data show 53 (B16F10) and 119 (MEC-1) Ca2+ events. p-Value, two-tailed Mann–Whitney test. e Number of Ca2+ events associated with the same CTL. Data show 55 (B16F10) and 36 (MEC-1) CTL. Data from b to d pooled from three (B16F10) and two (MEC-1) independent experiments. p-Values, two-tailed Mann–Whitney test. f Number of Ca2+ events per CTL contact plotted against frequency of sequential Ca2+ events in MEC-1/OVA cells compared to the B16F10/OVA cells. Data from 53 (B16F10) and 119 (MEC-1) Ca2+ events pooled from 3 (B16F10/OVA) and 2 (MEC-1/OVA) independent experiments. Source data are provided as a Source Data file.

