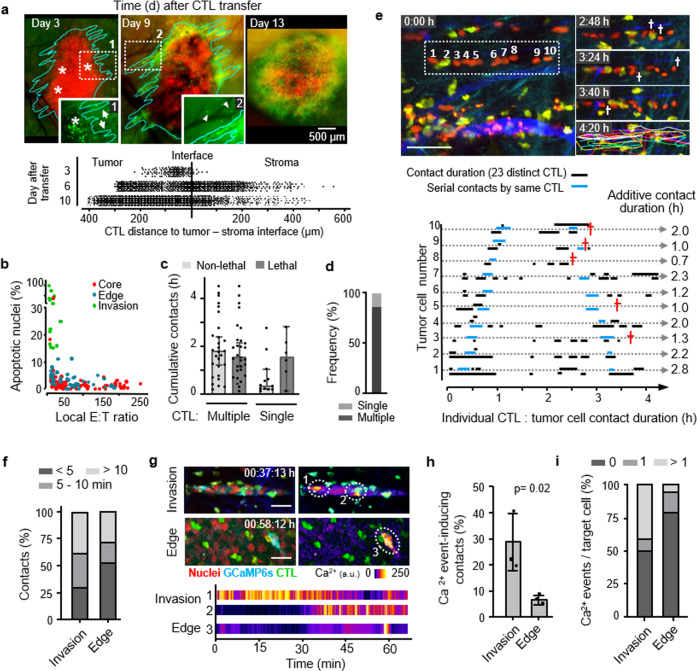
Fig. 6. Additive cytotoxicity in live tumors detected by intravital multiphoton microscopy.
a Time-dependent CTL accumulation along the tumor–stroma interface. Red, nuclei B16F10/OVA cells; green: OT1 CTL. Lower panel, position of individual CTL. Representative example of one tumor. b Correlation of CTL density and apoptotic frequency in tumor subregions. Data show 135 apoptosis events pooled from 8 independent mice. c Cumulative contact duration and outcome of single or multiple CTL contacting B16F10/OVA cells. Data represent the median with whiskers from 25 to 75 percentile values. d Frequency of apoptosis induction associated with single or multiple interacting CTL. Data in c, d represent N = 40 nonlethal and 37 apoptotic events from 150 h of movies pooled from 20 independent tumors. Error bars, mean ± SD. e Representative micrographs and quantification of serial engagements of multiple CTL with B16F10/OVA cells and outcome. Red cross, target cell apoptosis. Ten target cells from one tumor. f Percentage of contacts between CTL with B16F10/OVA cells and duration category in the invasion zone vs. tumor edge. g Images from time-lapse recordings of GCaMP6s activity in B16F10/OVA target cells in distinct tumor subregions. Dotted circles indicate the example areas plotted for GCaMP6s intensity in the graph below. Image sequence shows a representative example from the dataset analyzed in h, i. h Percentage of CTL contacts that induced one or more Ca2+ events in invasion zones vs. CTL-rich subregions at the tumor edge. i Percentage of tumor cells receiving none, one, or more than one Ca2+ event within a cumulative observation time of 3 h per tumor subregion. Data in f, h, i represent 228 contacts from N = 4 independent mice. Data in h, mean ± SD (3 positions per subregion from N = 3 independent mice). p-Value, two-tailed Mann–Whitney test. Scale bars e, g, 50 µm. Source data are provided as a Source Data file.

