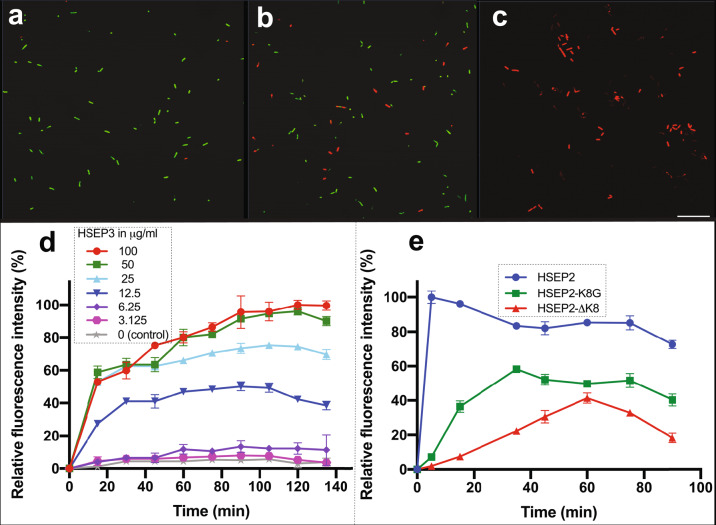
Fig. 4. Membrane permeabilization in B. cereus treated with HSEP3, HSEP2, and HSEP2-mutant peptides.
Upper panel: a Control, no peptide; b HSEP3 treated at 0.5X MIC concentration, and c HSEP3 treated at 1X MIC concentration. All three samples treated with Syto-9 (in green, indicating live cells) and propidium iodide (in red, indicating dead cells). d Permeabilization of the cytoplasmic membrane of B. cereus as a function of HSEP3 peptide concentrations (0–100 μg/mL), calculated as percent of propidium iodide fluorescence. e Permeabilization of the cytoplasmic membrane of B. cereus by HSEP2, HSEP2-K8G, and HSEP2-∆K8 (2X MIC), indicated by percent of propidium iodide fluorescence. Data represent mean ± s.e.m. of three biological replicates. Scale bar denotes 25.40 μm.

