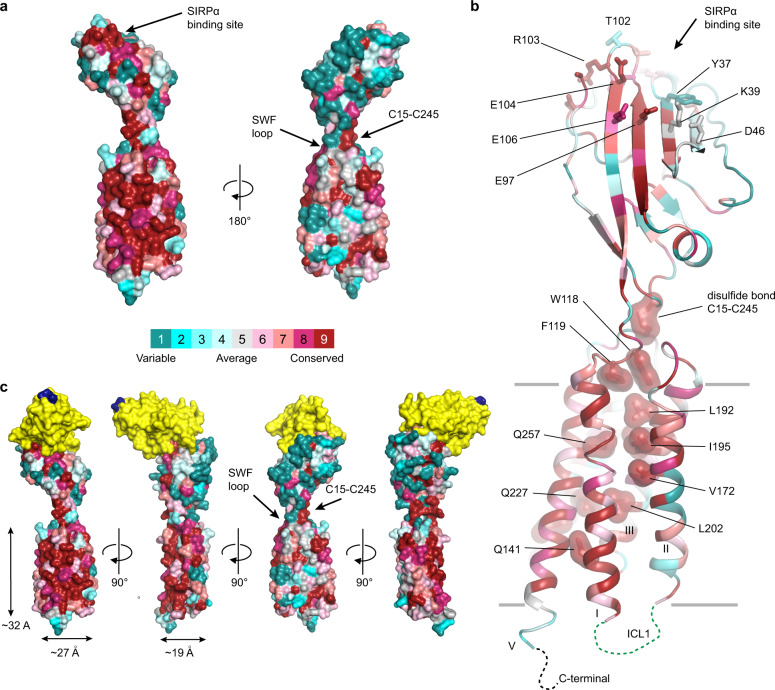
Fig. 4. Amino acid evolutionary conservation of CD47 and the SIRPα binding site.
a Two views of the CD47BRIL-B6H12 crystal structure (Fab atoms omitted) with the mammalian CD47 amino acid conservation (Supplementary Fig. 4; source data provided as a Source Data file) mapped on the surface representation of the receptor. The color scheme for the conservation scores is shown as a colored bar. b Cartoon representation of the CD47BRIL-B6H12 crystal structure (Fab atoms omitted) colored according to the conservation scale bar presented in (a). The side chains of highly conserved residues with a score of 9 in the conservation scale, located in the core of the TMD, in the ECLR or IC hydrogen bond network are shown as dark red surfaces. The side chains of C15 and C245, are also shown as dark red surface. CD47 residues that form the SIRPα binding site are shown as sticks; some non-conserved residues in the vicinity of the epitope are also shown. Gray lines represent the approximate lipid membrane boundaries. Disordered ICL1 and C-terminal residues are represented by green and black dotted lines respectively. Amino acid evolutionary conservation data are provided in Supplementary Fig. 4. Source data are provided as a Source Data file. c Superposition of the full-length CD47BRIL-B6H12 crystal structure (Fab atoms omitted) with the crystal structure of the soluble CD47 ECD in complex with SIRPα, PDB ID 2JJT [10.2210/pdb2JJT/pdb]. The ECD of both CD47 structures were used for the structural alignment. The full-length CD47 is shown as a surface representation and colored as in (a); the SIRPα is shown as yellow surface. The last C-terminal residue of SIRPα domain 1 is colored blue for reference.

