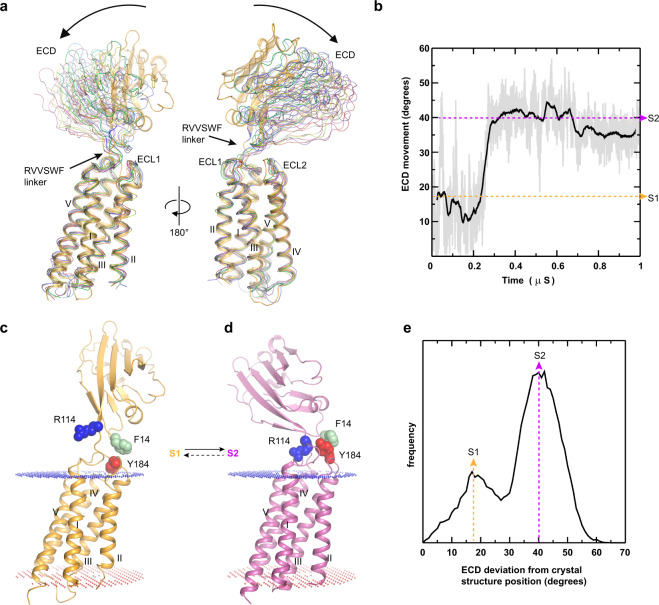
Fig. 6. CD47 macrostates.
a Representative models of CD47 during the course of the molecular dynamics simulations taken at 0.1 μs intervals (10 models shown) showing the range of motion of CD47 ECD. The CD47 crystal structure (starting model for the simulation) is shown as a yellow cartoon and the molecular dynamics models (0.1–1 μs) are shown as thin tubes. b Plot showing the measured tilt (degrees) between ECD and TMD during the molecular dynamics simulations showing the transition from the s1 to s2 macrostates. The yellow (s1) and light pink (s2) dotted lines indicate the average ECD orientations in each macrostate. The gray line indicates the nanosecond fluctuations and the black line the time average over every 1 ns within the single simulation trace. c–d Cartoon representations of full-length CD47 models from the simulations with ECD conformations corresponding to the average macrostates s1 (yellow) and s2 (light pink). The side chains of R114, Y184, and F14 are shown as blue, red, and light green spheres respectively. e Plot showing the frequency distribution of the ECD positioning with respect to the TMD (measured as the angle deviation, in degrees, from the crystal structure, which is the starting molecular dynamics model, time = 0 μs). The yellow (s1) and pink (s2) dotted lines indicate the average ECD orientations in each macrostate.

