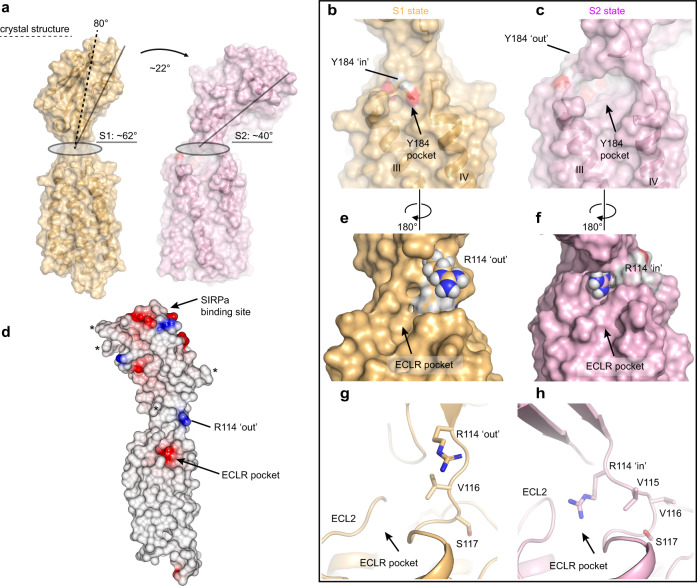
Fig. 7. Snapshots of full-length CD47 in s1 and s2 macrostates.
a Surface representation of full-length CD47 models with ECD orientations corresponding to the average s1 (yellow) and s2 (light pink) macrostates with respect to the TMD. Differences in ECD tilt angle between s1 and s2 are indicated by black solid lines and labeled. A dotted black line indicates the ECD angle with respect to the TMD observed in the CD47BRIL-B6H12 crystal structure. b–c Side-by-side comparison of the Y184 large pocket between ECL1 and ECL2 showing the position of Y184 side chain in the average s1 macrostate (Y184 ‘in’ position) and in the average s2 macrostate (Y184 ‘out’ position). d Surface electrostatic potential representation of CD47BRIL-B6H12 crystal structure (B6H12 atoms omitted) indicating the negatively charged ECLR pocket between helix I and V, the position of R114, and the SIRPα binding site on the ECD. Asterisks indicate the position of the N-linked glycosylation sites. e–f Side-by-side comparison of R114 side chain in the average s1 macrostate (R114 ‘out’ position) and in the average s2 macrostate (R114 ‘in’ position) and movement of the R114 into the negatively charged ECLR pocket. g–h A cartoon representation of (e) and (h) showing the conformational rearrangement of the 114RVVSWF119 linker during molecular dynamics simulations. The side chain of residues are shown as sticks.

