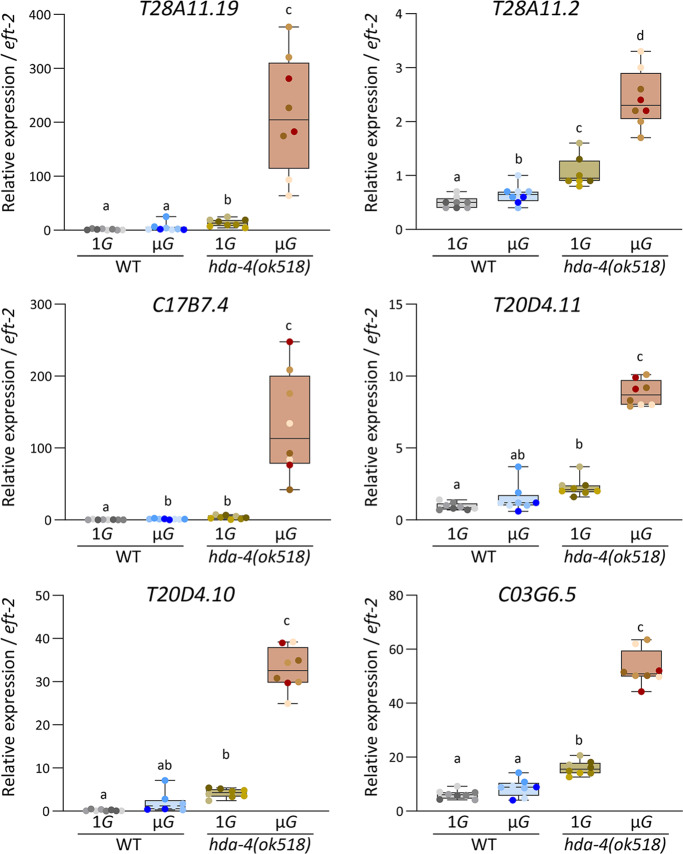
Fig. 3. Changes in gene expression of 6 DUF-19-containing genes, T28A11.19, T28A11.2, C17B7.4, T20D4.11, T20D4.10, and C03G6.5 assessed by quantitative real-time PCR.
Expression levels were analyzed in 8 samples each of wild-type and hda-4 mutants grown in either microgravity or artificial 1G (2 independent lines over four generations). The eft-2 gene was used as the internal standard. Data are shown as box and whiskers to indicate median and range. Statistical analysis was performed in each condition using one-way ANOVA followed by Tukey post hoc test.

