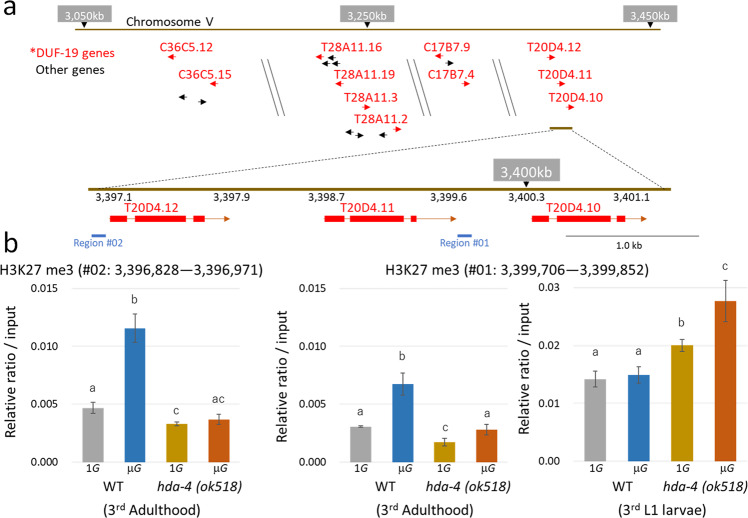
Fig. 4. ChIP analysis of H3K27me3 levels at the T40D4.12-4.10 locus.
a H3K27me3 levels were analyzed in the intergenic region of the T40D4.12-4.10 locus on Chromosome V. The red-colored gene is a gene containing the DUF-19 domain. b The graphs show the recovery rates for region #01 and #02, as a relative ratio of DNA after ChIP with the anti-H3K27me3 monoclonal antibody compared to the input DNA in adults wild-type and hda-4 mutant, respectively. Due to the sample limitations, L1 larvae study was limited to analysis of the H3K27me3 status at the region #01. These samples (about 300 worms each) grew as third generation under artificial 1G or microgravity conditions. Biological triplications in each sample condition (n = 3) were analyzed by ChIP-qPCR using one-way ANOVA followed by Tukey post hoc test. Error bars indicate S.D.

