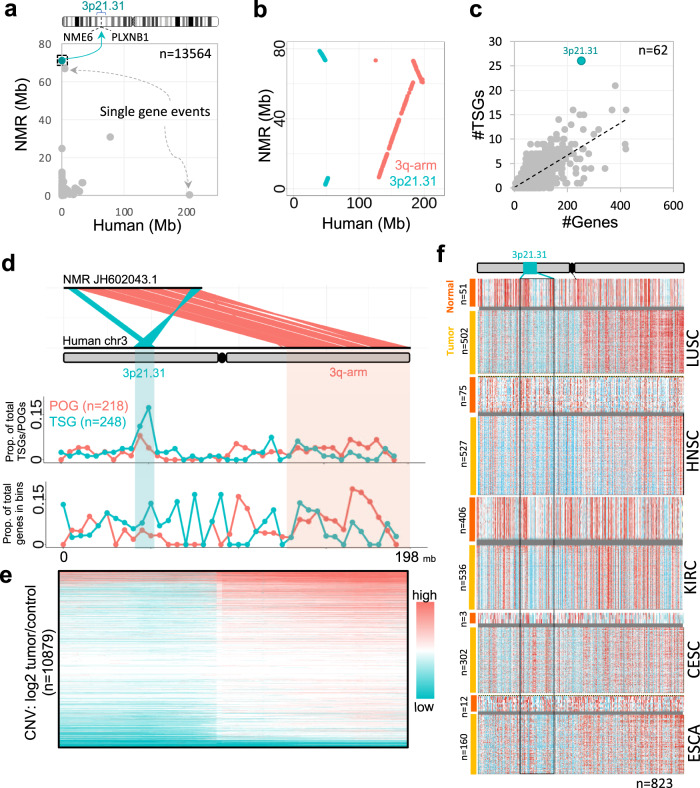
Fig. 1. Genomic rearrangements and tumour-suppressor properties of 3p21.31.
a Scatter plot of all intergenic distances between consecutive genes of human vs. that of corresponding NMR orthologues. The box on the y axis highlights the genes (NME6 and PLXNB1) that were proximal in human, but distant in NMR, and marks the large genomic split of 3p21.31 locus. The events of single-gene repositioning are marked by grey arrows. Details of these events are given in Supplementary Fig. 1a, b. b Dot plot between human chr3 and NMR JH602043.1 scaffold. Sea-green coloured dots represent 3p21.31 locus, while the 3q arm of chr3 is shown in red. c Number of tumour-suppressor genes as a function of the total number of genes in each chromosomal band of human genome. The 3p21.31 cluster is marked in sea-green colour. d Upper panel: linear view of genomic rearrangements between human chr3 and NMR JH602043.1. Middle and lower panels: density of proto-oncogenes and tumour-suppressor genes along human chr3, normalised by the total number of TSGs and POGs (upper panel), and by the total number of genes in respective chromosomal bands (lower panel). e Copy number variations along human chr3 in TCGA Pan-cancer dataset (n = 10,879). Each horizontal line represents one instance of CNV, each row represents one patient, and the colour grade scales to the tumour-to-control ratio of genomic DNA in TCGA Pan-Cancer dataset. f Gene expression (RNA-seq data normalised to TCGA cohort) of tumour and normal tissues along chromosome 3. Data shown in panels e and f were directly obtained from UCSC Xena browser. LUSC lung squamous cell carcinoma, HNSC head–neck squamous cell carcinoma, KIRC kidney renal clear cell carcinoma, CESC cervical squamous cell carcinoma and endocervical adenocarcinoma, ESCA oesophageal carcinoma.

