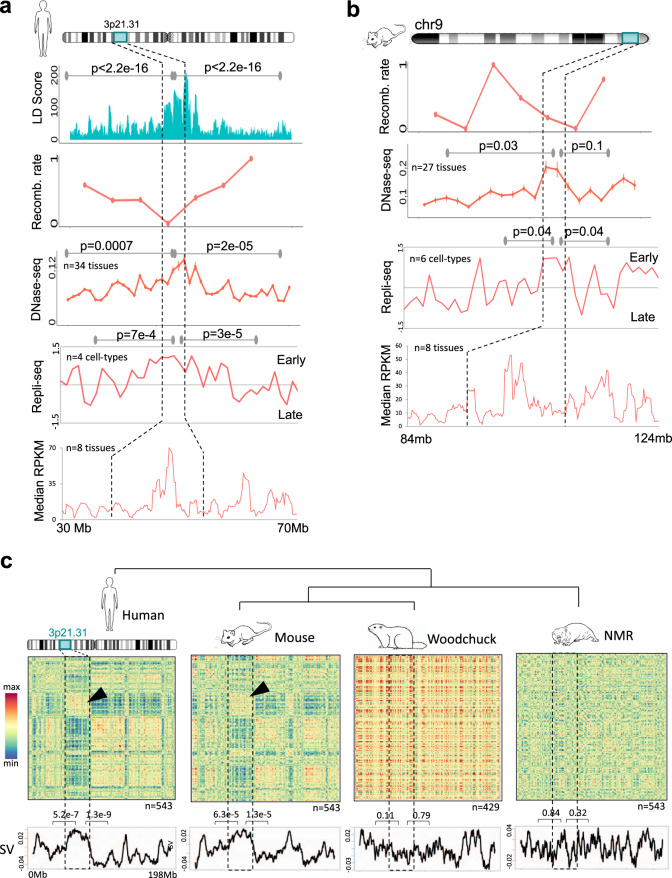
Fig. 4. Genetic and epigenetic attributes of 3p21.31 in human and mouse.
a, b Linkage disequilibrium (LD) score, recombination rate, chromatin accessibility (across 34 human and 27 mouse tissues), replication timing (across four human and six mouse cell types) and the median expression levels of genes (across eight tissues) in human (a) and in mouse (b). P values for the comparison of values in the 3p21.31 locus and in the adjacent regions were calculated using two-sided Mann–Whitney U tests. Error bars represent 95% confidence intervals. Effect sizes: 0.25 and 0.29 for LD score; 0.63 and 0.41 for DNase-seq (human); 0.66 and 0.16 for DNase-seq (mouse); 0.99 and 1.28 for Repli-seq (human); 0.66 and 1.2 for Repli-seq (mouse). c Co-expression heatmaps of genes from human chromosome 3, and the corresponding orthologues in mouse, woodchuck and naked-mole rat. Below each heatmap is the leading singular vector (SV) of co-expression matrix. High overall SV values at 3p21.31 in human and mouse signify its secluded transcriptional co-regulation, which was largely independent from rest of the chr3. P values were calculated using two-tailed unpaired t-test using the same approach as in Fig. 3b. Effect sizes: 0.82, 1.01 (human); 0.64, 0.71 (mouse); 0.26, 0.04 (woodchuck); 0.02, 0.15 (NMR).

