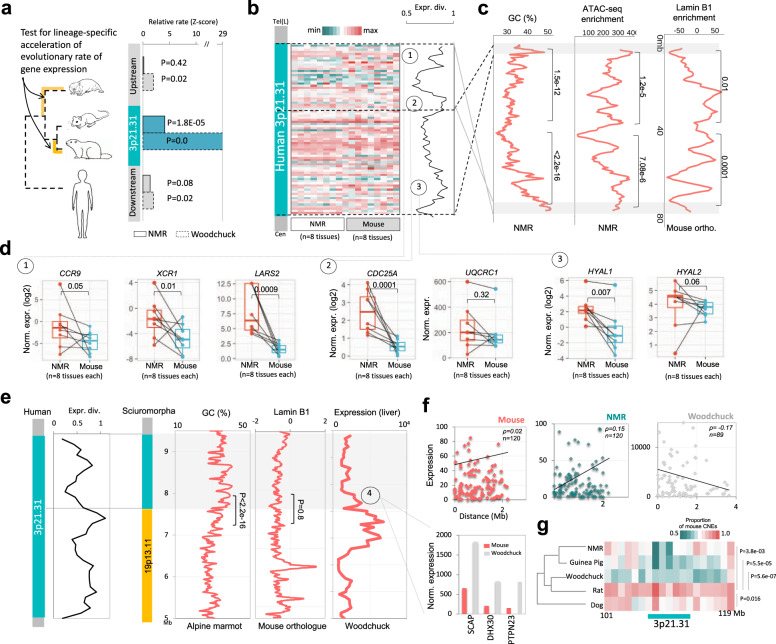
Fig. 5. Hystrico- and sciuromorph-specific relaxation of functional constraints on 3p21.31.
a Rate of gene expression evolution in NMR and woodchuck, considering mouse as control and human as an outgroup. Expression rates are presented as Z score and the P values are from Z test. b Heatmap: quantile-normalised expression data of 3p21.31 genes in the skin, thymus, ovary, kidney, adrenal, heart, testes and liver (in that order) of mouse and of NMR. Line plot: mouse-to-NMR expression divergence of genes. c GC content, chromatin accessibility (ATAC-seq enrichment in NMR skin fibroblasts), and ChIP-Seq LaminB1 enrichment (mouse fibroblasts) along NMR scaffold JH602043.1. P values were calculated using two-sided Mann–Whitney U tests. Effect sizes: 0.54 and 0.73 for GC content; 0.17 and 0.17 for ATAC-seq; 0.073 and 0.18 for LaminB1 enrichment. d Quantile-normalised gene expression values of genes (for the same tissues as in b) located towards the breakpoint regions that are highlighted in the line plot of 3p21.31 expression divergence. The matching tissues of the mouse and NMR are marked by connecting lines between paired boxes. P values were calculated using two-sided Mann–Whitney U tests. Boxplot annotation: centre line, median; box limits, upper and lower quartiles; whiskers, 1.5× interquartile range; points, outliers. Effect sizes: 0.19, 0.28, 0.70, 0.70, 0.06, 0.39, and 0.15 from left to right. A comparison of normalised expression values of mouse and woodchuck genes near the breakpoint region-4 is shown in the barplot. e Left panel: gene-wise expression divergence between mouse and woodchuck along 3p21.31 locus. Right panel: GC content (Alpine marmot), LaminB1 enrichment (in mouse orthologous regions), and gene expression (woodchuck liver) across the rearranged locus involving part of 3p21.31 and 19p13.11 loci. P values were calculated using two-sided Mann–Whitney U tests. Effect sizes: 0.54 for GC content, 7.9e-6 for LaminB1 enrichment. f Expression of 3p21.31 genes in mouse, NMR and woodchuck as a function of distance from the nearest breakpoint. Mean expression levels across tissues were plotted. Effect sizes: Pearson’s correlation coefficient (ρ) are mentioned in the plots. g Proportion of mouse-conserved mammalian CNEs present in NMR, woodchuck, guinea pig, rat and dog. P values were calculated using two-tailed t tests between rat and other species. Effect sizes: 1.91, 3.24, 5.12, 1.65 for NMR–rat, GP–rat, Woodchuck–rat and dog–rat comparisons respectively.

