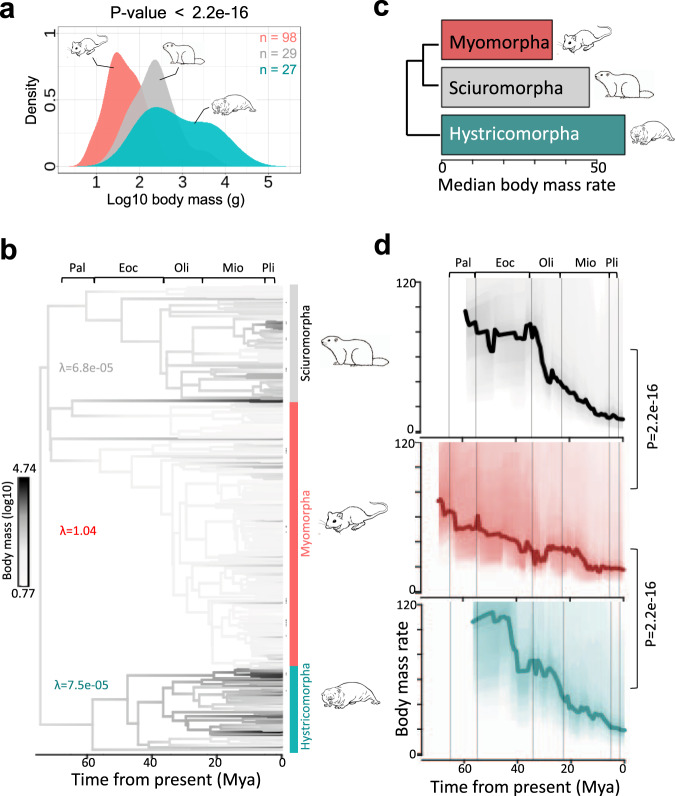
Fig. 6. Rate of body mass evolution in rodent clades.
a Distribution of log10 body mass of myo-, hystrico- and sciuromorphs. P value was calculated using Kruskal–Wallis test. b Ancestral reconstruction of body mass across phylogenetic tree of 312 rodent species. Pagel’s λ values were calculated using ‘phyloSig’ function of ‘phytools’. c Median rate of body mass evolution in myo-, hystrico- and sciuromorphs. d Rate of body mass evolution in myo-, hystrico- and sciruomorphs as a function time from the present. Body mass rates were calculated using the BAMM model. P values were calculated using two-sided Mann–Whitney U tests.

