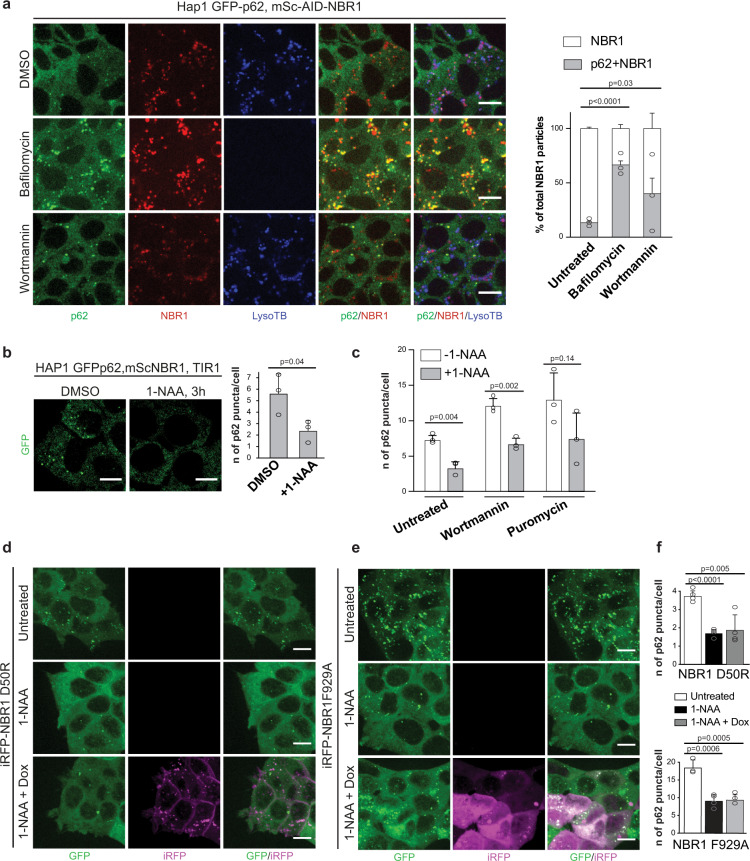
Fig. 3. The PB1 and UBA domains of NBR1 promote condensates formation in cells.
a HAP1 mSc-AID-NBR1, GFP-p62 cells were left untreated (DMSO) or treated with bafilomycin (400 nM) or wortmannin (1 µM) for 2h. Endogenously tagged proteins and LysoTracker Blue (LysoTB) stained lysosomes were visualized by live-cell imaging using a Live Spinning Disk microscope. Scale bar, 10 µm. The total number of NBR1 particles not overlapping with the LysoTB signal are plotted together with the subset of NBR1 particles which colocalize with GFP-p62. Average percentages of colocalization and standard deviations for n = 3 are shown. An unpaired, two-tailed Student’s t test was used to estimate significance. P values are indicated in the figure. b HAP1 GFP-p62, mSc-AID-NBR1, TIR1 cell line was left untreated (DMSO) or treated with 1-NAA for 3 h. p62 puncta in the cells (GFP channel) were visualized by Live Spinning Disk microscopy. Scale bar, 10 µm. The average number of GFP-p62 puncta/cell and standard deviations for n = 3 are shown. An unpaired, two-tailed Student’s t test was used to estimate significance. P values are indicated in the figure. The same experiment performed on the control cell line not containing TIR1 is shown in Supplementary Fig. 3b. c HAP1 mSc-AID-NBR1, GFP-p62, TIR1 cells were left untreated (DMSO) or treated with 1-NAA for 3 h in combination with puromycin (5 µg/ml) or wortmannin (1 µM). GFP-p62 puncta in the cells were visualized by live-cell imaging. Average p62 puncta number and standard deviation for n = 3 are plotted. An unpaired, two-tailed Student’s t test was used to estimate significance. P values are indicated in the figure. d, e HAP1 mSc-AID-NBR1, GFP-p62, TIR1 stably expressing iRFP-NBR1 D50R (d) or iRFP-NBR1 F929A (e) were left untreated (DMSO) or treated with 500 µM 1-NAA with or without 50 ng/ml doxycyclin for 12 h. After treatment GFP-p62 and iRFP-NBR1 puncta were visualized by live-cell imaging. Scale bar, 10 µm. Expression levels of p62 and NBR1 upon treatments are shown in Supplementary Fig. 3c. The same experiment, performed with the GFP-p62, mSc-NBR1, TIR1 cell line stably transfected with iRFP-NBR1 WT, is shown in Supplementary Fig. 3d. f Quantification of the experiments in (d) and (e). The average number of GFP-p62 puncta/cell and standard deviations for n = 4 are shown (top graph for the iRFP-NBR1 D50R expressing cells, bottom graph for the NBR1F929A expressing cells). An unpaired, two-tailed Student’s t test was used to estimate significance. P values are indicated in the figure.

