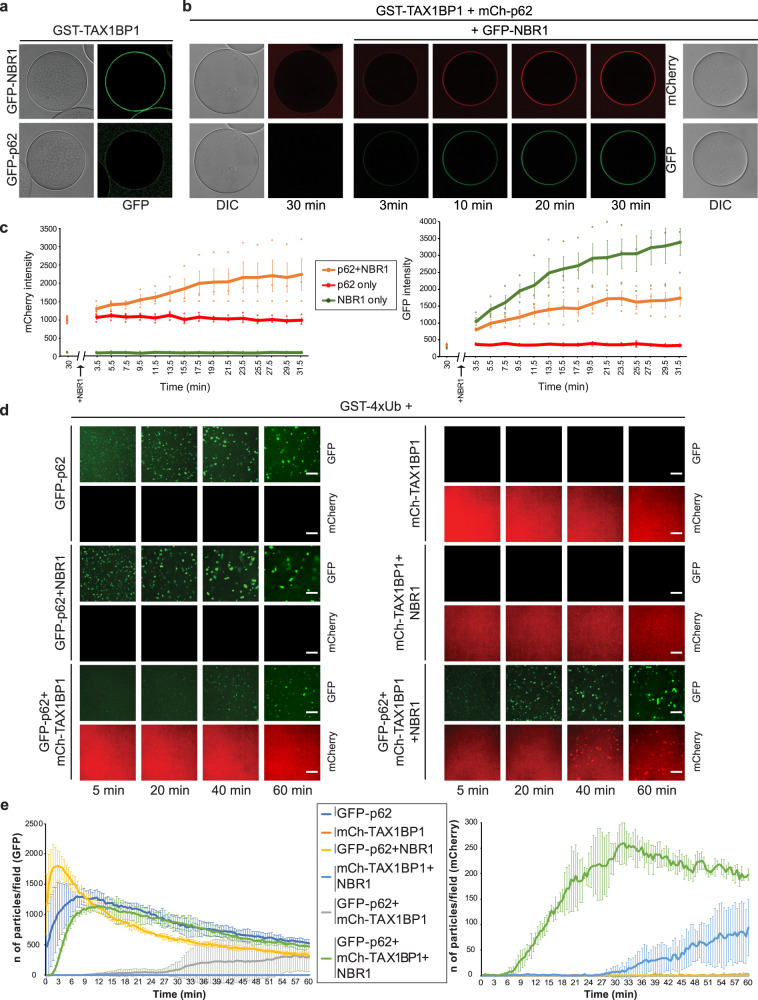
Fig. 4. NBR1 recruits TAX1BP1 to p62–ubiquitin condensates in vitro.
a Microscopy-based pull-down showing TAX1BP1 interaction with NBR1 and p62. The recruitment of GFP-NBR1 (2 µM) and GFP-p62 (2 µM) to GST-TAX1BP1 coupled glutathione beads at the equilibrium was followed by confocal microscopy. The experiment was done in three independent replicates. Negative binding control with GST coupled beads is shown in Supplementary Fig. 4a. SDS-Page gel with the protein inputs is shown in Supplementary Fig. 4b. b GST-TAX1BP1 coupled glutathione beads were incubated with 2 µM mCherry-p62 for 30 min and imaged by confocal fluorescent microscopy. Then, GFP-NBR1 (final concentration 2 µM) was added to the reaction and the recruitment of both mCherry-p62 and GFP-NBR1 to GST-TAX1BP1 coated beads was followed by confocal fluorescent microscopy for 30 min (one image every 2 min). c Quantification of the experiment shown in (b). The mCherry and GFP signal intensity on the beads is plotted against time. A reaction without GFP-NBR1 and one without mCherry-p62 were used as controls to monitor the recruitment of the single receptors over time. Average signal intensity (mCherry—left graph and GFP—right graph) and standard deviations for n = 3 are shown. d Dynamics of ubiquitin condensate formation with GST-4xUb (5 µM), GFP-p62 (2 µM), NBR1 (1 µM) and mCherry-TAX1BP1 (2 µM). Cargo receptors were added to the reactions in the indicated combinations. Three independent replicates of the experiment were performed. Images of the GFP-p62 and mCherry-TAX1BP1 condensates for every condition at representative time points are shown. Scale bar: 10 µm. Negative controls for the condensate formation reactions and protein inputs are shown in Supplementary Fig. 4c and d respectively. e Quantification of the condensate formation experiment in (d). The number of condensates per field of imaging at every time point in each channel were counted and plotted against time. The number of p62 condensates (green channel) is shown on the left graph and the number of TAX1BP1 condensates (red channel) is shown on the right graph. Average fluorescence intensity and standard deviation for n = 3 is shown. Source Data are provided as a Source Data file.

