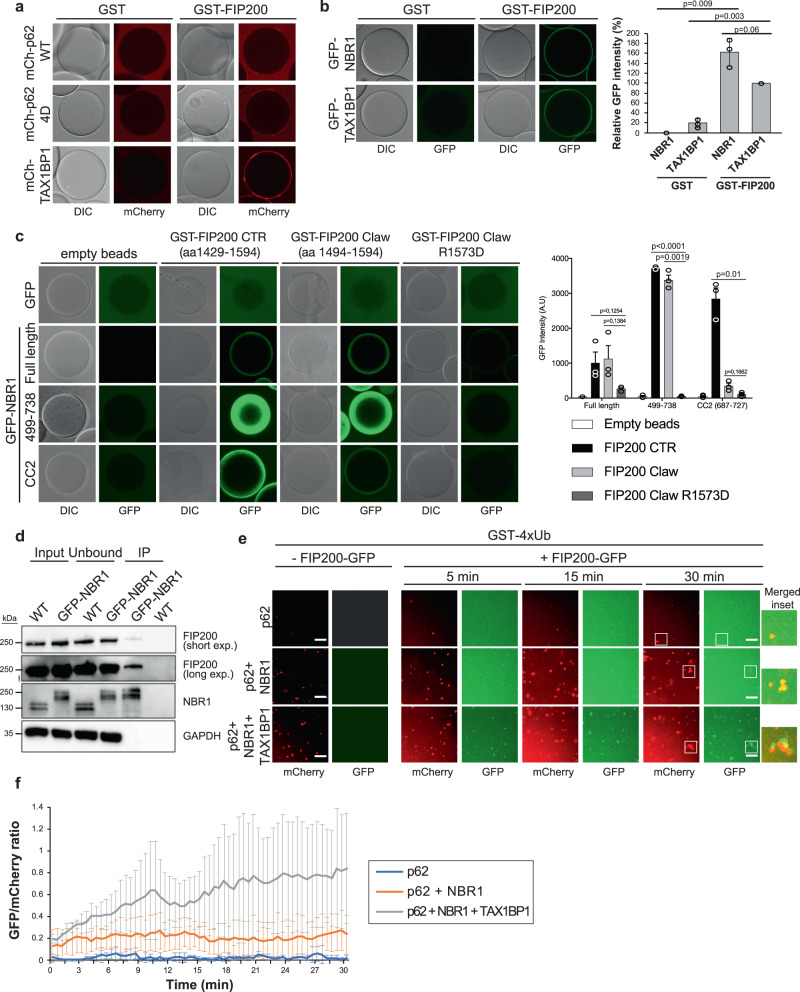
Fig. 5. Receptors mediate the recruitment of FIP200 to ubiquitin condensates.
a Glutathione beads were coupled with GST or GST-FIP200 and incubated with mCherry-p62 WT (2 µM), mCherry-p62 4D (phosphomimicking mutant – 2 µM) or mCherry-TAX1BP1 (2 µM). After 1 h incubation at room temperature beads were imaged at the equilibrium with a LSM700 microscope. The experiment was done in three independent replicates. Recombinant purified proteins used for the assay are shown in Supplementary Fig. 5a. b GST or GST-FIP200 coupled glutathione beads were incubated with GFP-NBR1 (2 µM) or GFP-TAX1BP1 (2 µM). After 30 min incubation the beads at the equilibrium were visualized with a LSM700 confocal microscope. The average GFP signal ± SEM for n = 3 is plotted. An unpaired, two-tailed Student’s t test was used to estimate significance. P values are indicated in the figure. Recombinant purified proteins used in the assay are shown in Supplementary Fig. 5b. c Glutathione beads were left empty or coupled with GST-FIP200 CTR (aa 1429-1594), GST-FIP200 Claw (aa 1494-1594), or the GST-FIP200 Claw R1573D mutant. Each set of beads was incubated with 2 µM GFP or 2 µM of the indicated GFP-NBR1 constructs (see also Supplementary Fig. 5c) and imaged at the equilibrium by confocal fluorescent microscopy. The average GFP signal intensity ± SEM for n = 3 is shown. An unpaired, two-tailed Student’s t test was used to estimate significance. P values are indicated in the figure. SDS-Page gel with pull-down inputs is shown in Supplementary Fig. 5f. d Cell lysates from HAP1 WT and GFP-AID-NBR1 (Supplementary Fig. 1c) were incubated with GFP-trap beads. Beads bound material was analyzed by western blot to detect beads bound GFP-AID-NBR1 and co-immuno-precipitated FIP200. Input samples used for the experiment, unbound proteins, and immunoprecipitated proteins (IP) are shown in the figure. The experiment was done in three independent replicates. e Condensate formation reaction was performed with GST-4xUb (5 µM) and the indicated combinations of mCherry-p62 (2 µM), mCherry-TAX1BP1 (2 µM) and NBR1 (1 µM). After 30 min incubation at room temperature, formed condensates were imaged by spinning disk microscopy. Then, GFP-FIP200 (5 µM) was added to each reaction and its recruitment to the condensates over time was followed. Images of representative time points are shown. Scale bar: 10 µm. Protein inputs for the assay are shown in Supplementary Fig. 5g. f The number of condensates in each channel was counted and the GFP/mCherry ratio was plotted against time. Average GFP/mCherry ratio and standard deviation for n = 3 is shown. Source data are provided as a Source Data file.

