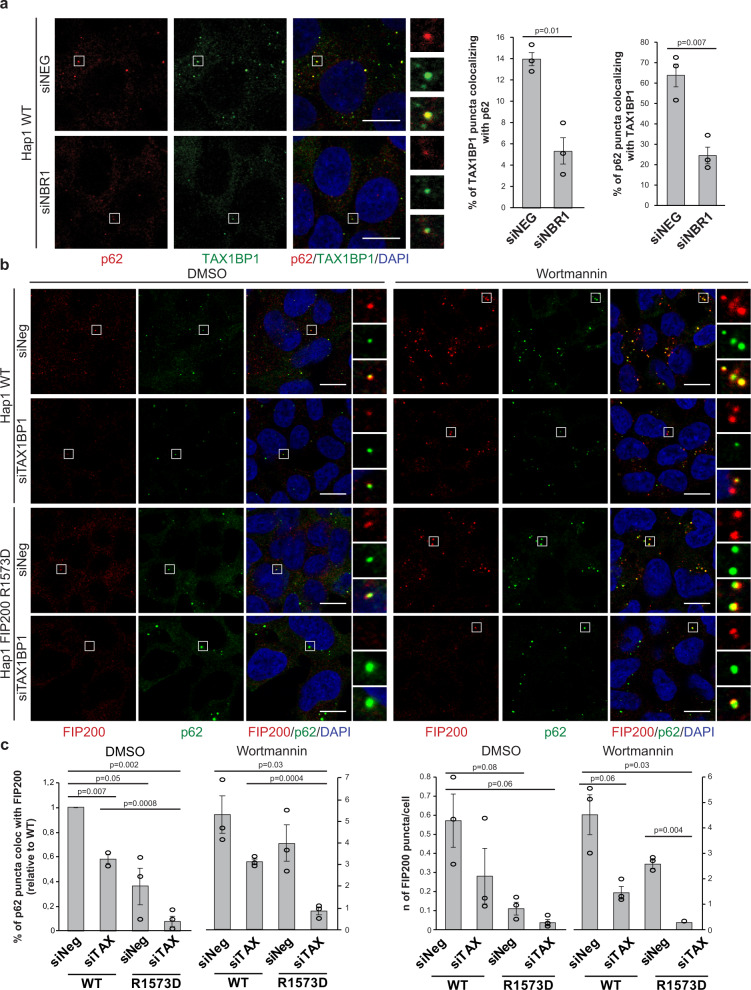
Fig. 6. TAX1BP1 promotes the recruitment of FIP200 to p62 condensates in cells.
a HAP1 WT cells were treated with a non-targeting siRNA (siNeg) or with NBR1 siRNA (20 nM for 48 h). Endogenous p62 and TAX1BP1 were visualized by immunofluorescent staining. Scale bar, 10 µm. TAX1BP1—p62 colocalization was analyzed. Average percentage of colocalization ± SEM for three independent experiments is shown. An unpaired, two-tailed Student’s t test was used to estimate significance. P values are indicated in the figure. Western blot showing the efficiency of the siRNA treatment is shown in Supplementary Fig. 6a. b HAP1 WT cells or cells where the R1573D mutation was introduced in the endogenous FIP200 (see also Supplementary Fig. 6b) were treated with non-targeting siRNA (siNeg) or with TAX1BP1 siRNA (20 nM). After 48 h cells were left untreated (DMSO) or treated with wortmannin (1 µM) for 2 h. Endogenous p62 and FIP200 were visualized by immunofluorescent staining. Scale bar, 10 µm. The efficiency of the siRNA treatment and levels of autophagy markers upon treatment are shown in Supplementary Fig. 6c. c Analysis of p62 colocalization with FIP200 (left plot) and FIP200 puncta/cells (right plot) for the experiment in Fig. 6b. Average puncta number/percentage of colocalization ± SEM for n = 3 are shown. An unpaired, two-tailed Student’s t test was used to estimate significance. P values are indicated in the figure.

