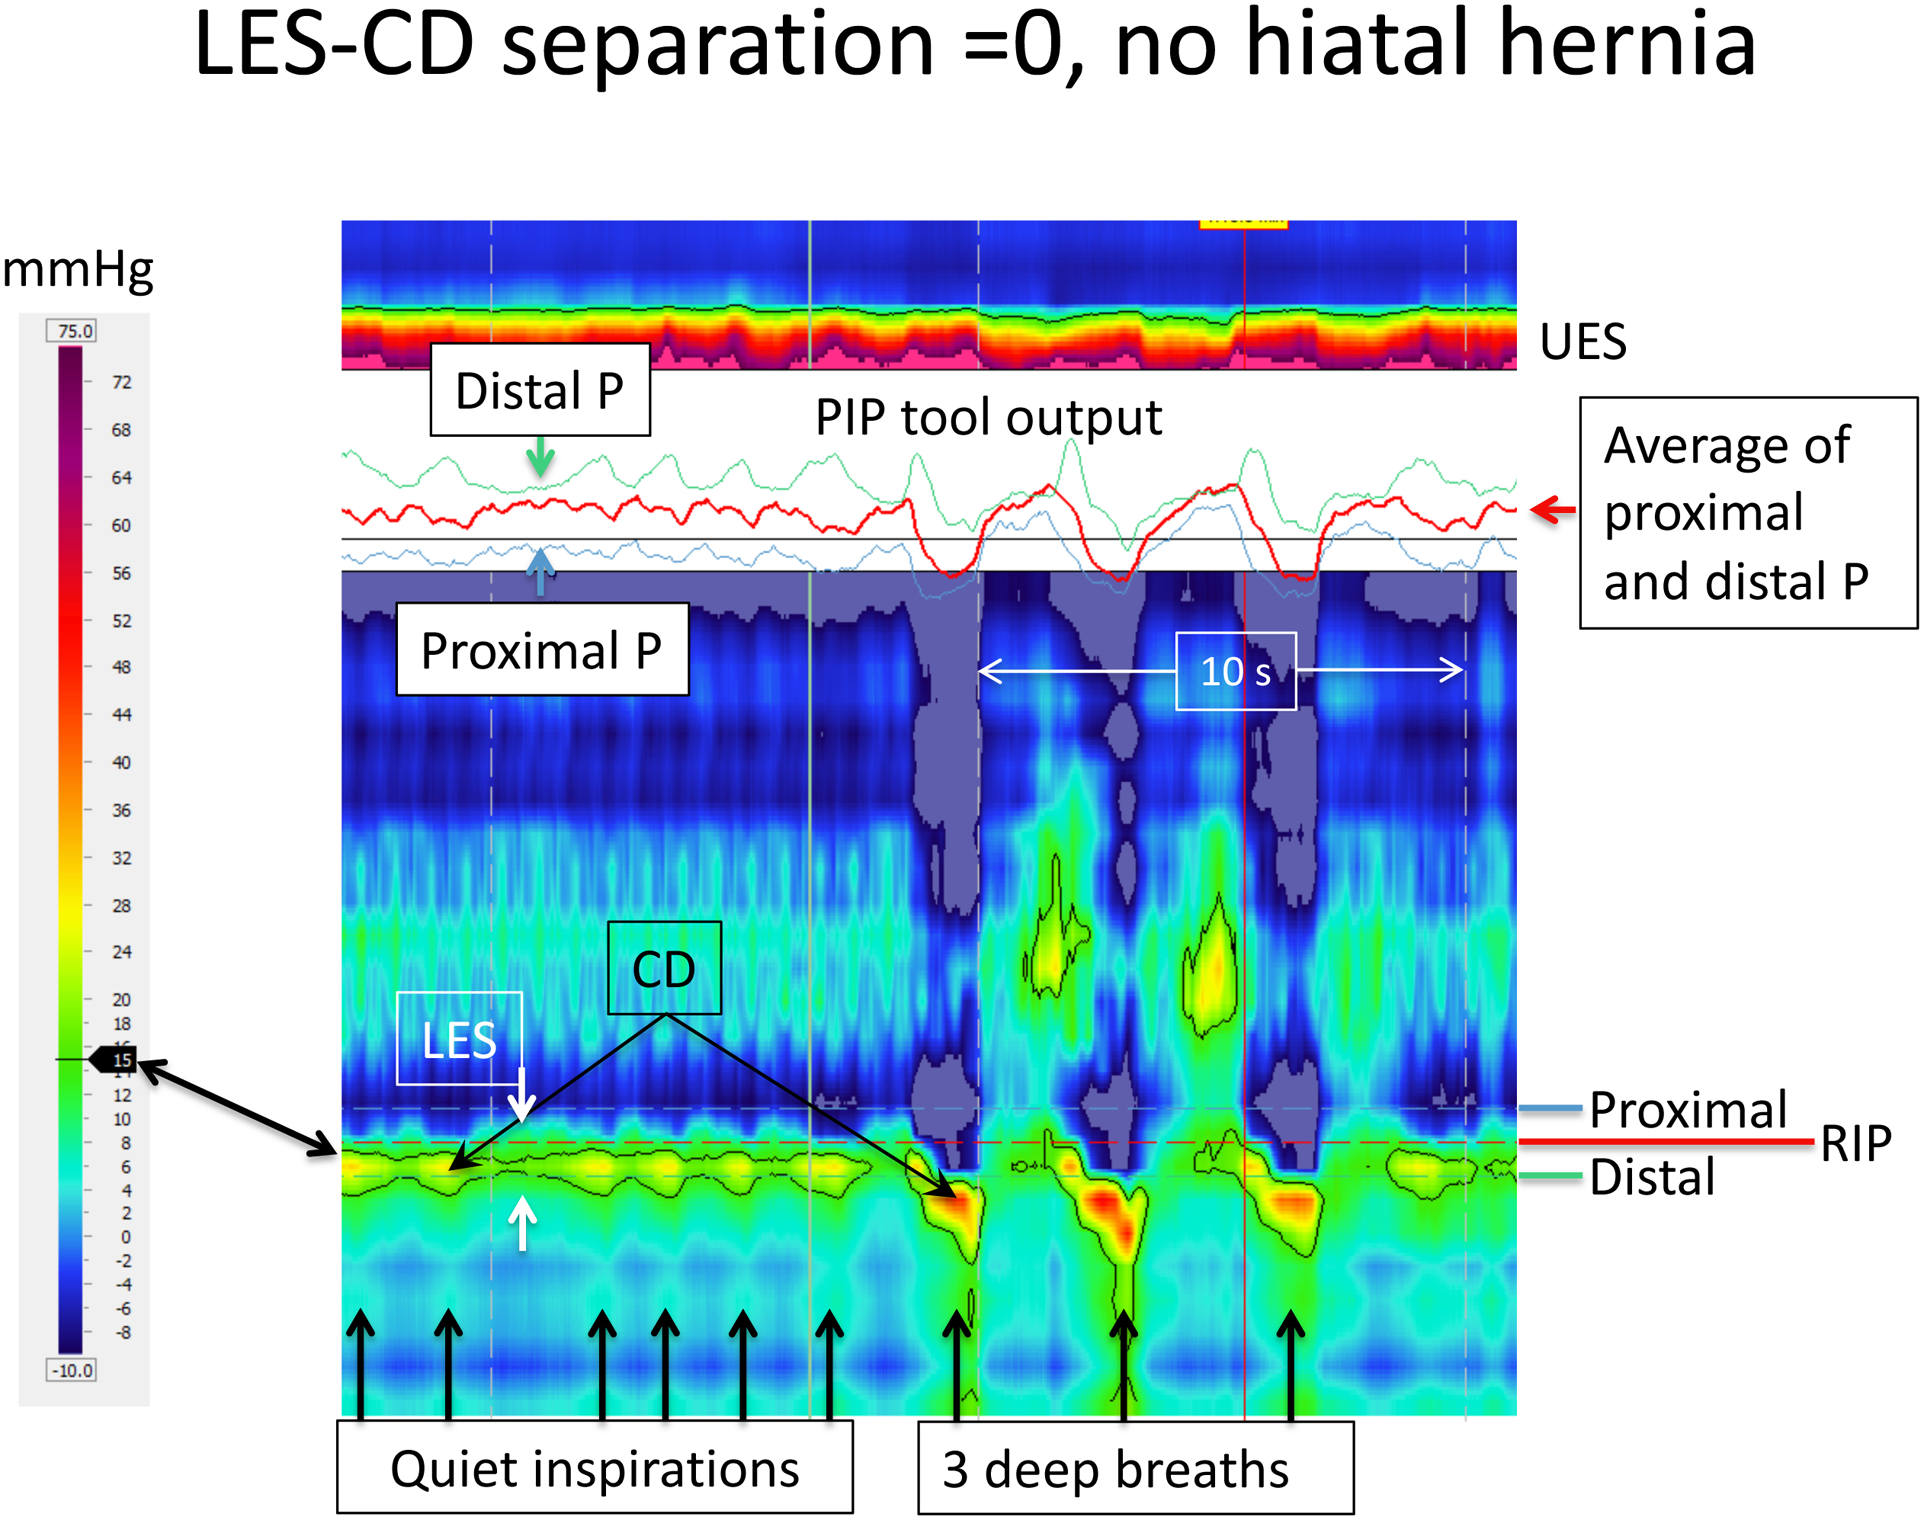
Figure 2.

HRM recording of EGJ pressure in an individual without a hiatal hernia as evident by the CD-apex being completely superimposed on the LES pressure signature, i.e. the LES-CD separation is 0. Both during quiet respiration and deep breaths, the LES is only evident between inspirations when the CD signal is minimal. In this example, the PIP tool has been positioned to optimally isolate the RIP as evident by the PIP tool output shown as an insert. Barely visible on the pressure topography are a horizontal blue and green dashed lines indicating the locations of the proximal and distal pressure (P) recordings shown in the PIP tool output. The red line in the PIP tool output box is the computed average of those signals. In using the tool, the area of interrogation is scrolled up and down to find the location at which the red line in the output box is most nearly flat, indicative of the site at which the respiratory increases in pressure (green line) are offset by the respiratory decreases in pressure (blue line). The area of interest is during quiet respiration and the RIP is seen to localize toward the upper margin of the CD. This positions the majority of the LES signal within the hiatus, being pulled downward during the three deep breaths. Figure used with permission from the Esophageal Center at Northwestern.
