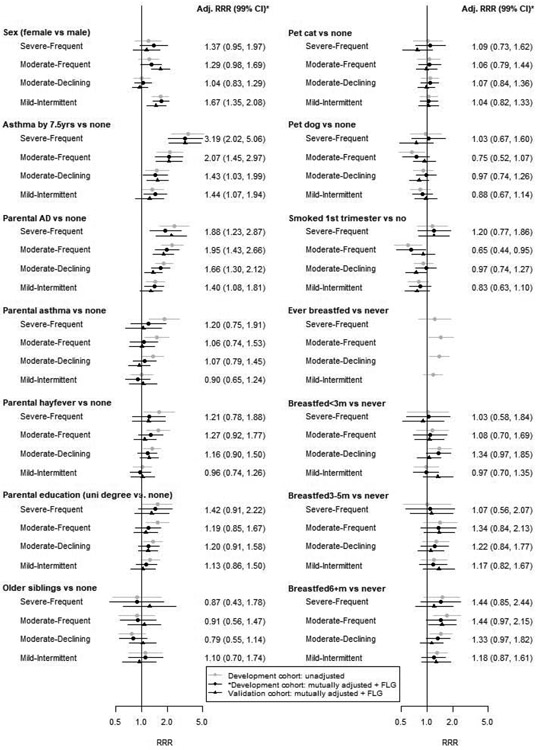
Figure 2: Associations of demographic and clinical characteristics with atopic dermatitis phenotypes.

Unadjusted and mutually adjusted phenotype associations in the development cohort (grey and black circles), and adjusted associations in the validation cohort (black triangles). All adjusted associations include additional adjustment for FLG null mutations. Stated effects and confidence intervals are for adjusted associations in the development cohort. Adj=adjusted; RRR=relative risk ratio; CI=confidence interval.
