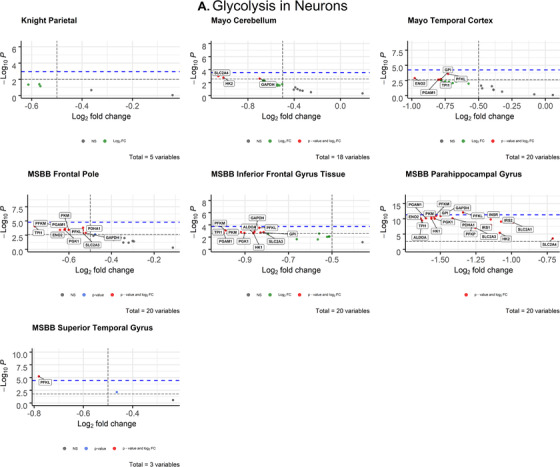
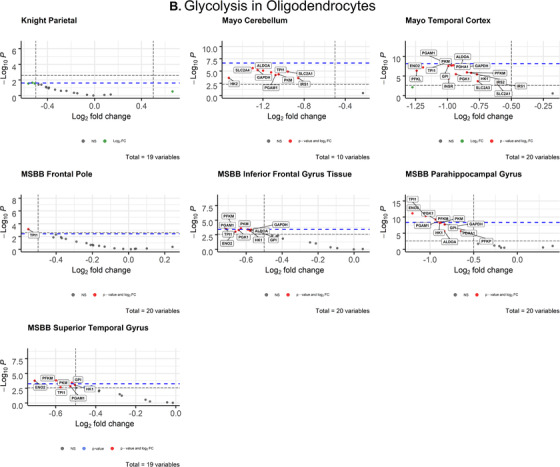
FIGURE 3.
Volcano plots of glycolytic gene expression from Alzheimer's disease patients in neurons (A) and oligodendrocytes (B) from each dataset. The ‐log10 P‐values of genes are plotted versus the log2FoldChange along the X‐axis. Bonferroni‐corrected α‐values are indicated by the black dashed line and the empirical P‐values are indicated by the blue dashed line. Genes with P‐values below either cutoff are plotted above their respective cutoff lines, marked in red, and labeled


