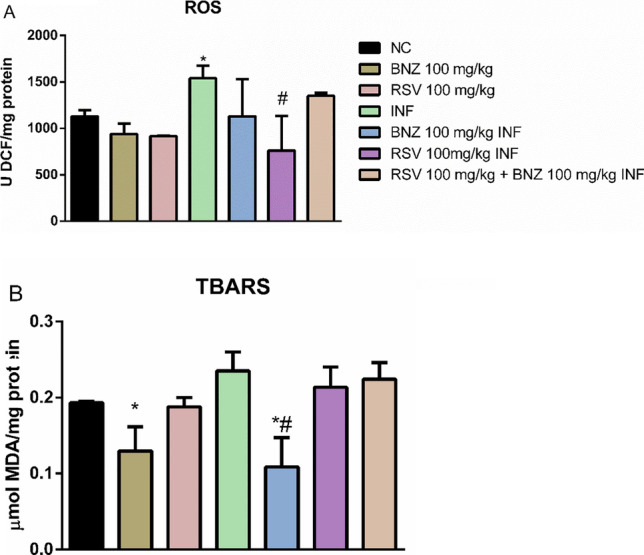
Fig. 4.

T. cruzi-infection promotes oxidative stress in the cortex. A—ROS levels; B–TBARS levels (NC: negative control, INF: infected group, BNZ: benznidazole group, RSV: resveratrol group). The data represent mean ± SEM analyzed using two-way ANOVA with post hoc Tukey test. *p < 0.05 (*significant differences compared to the control group) (# significant differences compared to the infected group)
