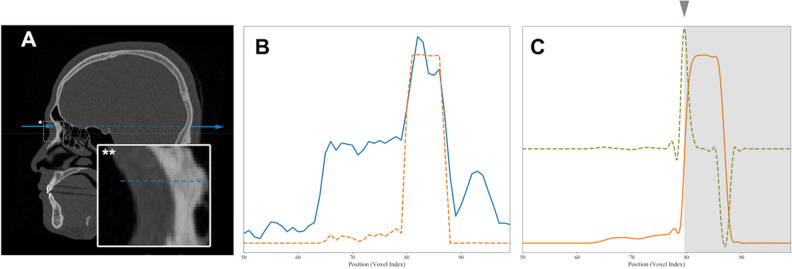
Figure 5.
Gradient-based boundary estimation for single-stage DRL. (A) A sectional CT image in the sagittal plane with a radiographic beam-mimic line (blue dashed line) passing through a sampled landmark, nasion and surrounding box with asterisk (*). The view of the box region is magnified in the inset box at the left bottom with double asterisks (**) and the y-directional line (blue solid). (B) One-dimensional plot of image density profile in Hounsfield units, shown as a blue solid line along the y-directional line passing through the air, through nasion, and the soft and bone tissue, indicated by the blue dashed line in Fig. A. The orange dashed line indicates the bone intensity-enhanced profile. (C) Plot of the same source for B showing the non-linear diffusion profile of the bone intensity-enhanced one (orange solid line), its first order derivative profile (light green dashed line), and the final boundary estimation of bone (marked by arrowhead and gray region).

