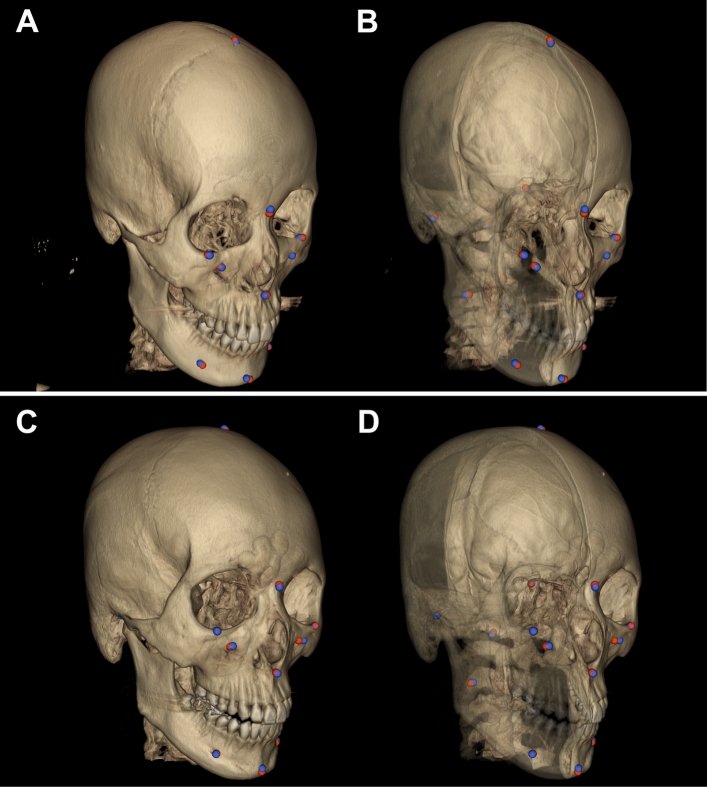
Figure 6.
The best and worst landmark prediction results from the test group. A and B were from Subject 1 (Table 2), which showed the best prediction result of 1.57 ± 0.55 mm in prediction error, while C and D were from Subject 8, with the worst prediction result (2.41 ± 0.97 mm). The red ball points on and in the skull were produced by the experts and the blue ones by our DRL system. The right half of the skull for each subject is translucent to show the location of predicted landmarks.

