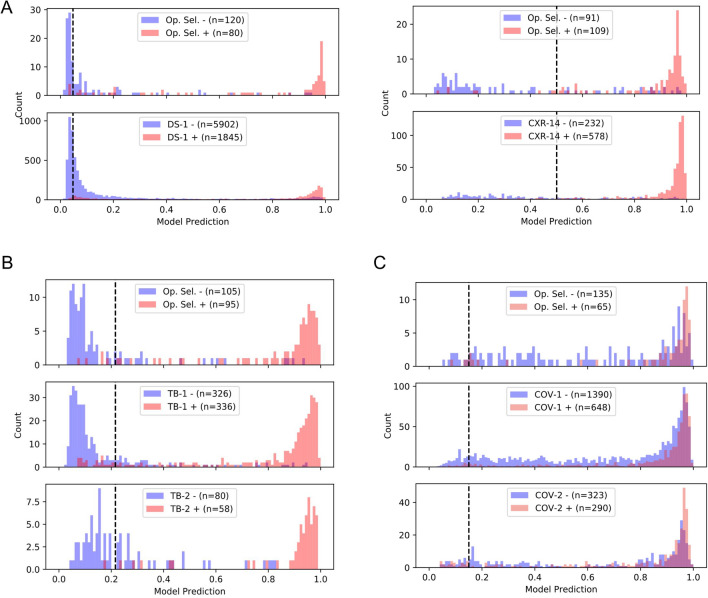
Figure 4.
Histogram for the distribution of DLS predicted scores across 6 datasets and their corresponding operating point selection sets: (A) DS-1 and CXR-14, (B) TB-1 and TB-2, and (C) COV-1 and COV-2. Curation of the operating point selection (Op. Sel.) datasets is described in “Operating point selection datasets” in “Methods”. Positive and negative examples are visualized separately in red and blue, respectively. The vertical lines (black) highlight the selected high-sensitivity operating point for each scenario.

