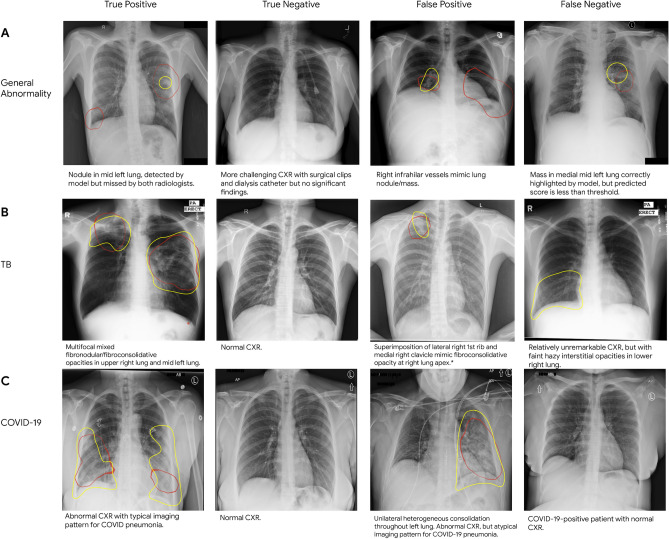
Figure 5.
Sample CXRs of true and false positives, and true and false negatives for (A) general abnormalities, (B) TB, and (C) COVID-19. Each image has the class activation map presented as red outlines that indicate the areas the DLS is focusing on for identifying abnormalities, and yellow outlines representing regions of interest indicated by radiologists. Text descriptions for each CXR are below the respective image. Note that the general abnormality false negative example is shown with abnormal class activation maps. However, the DLS predictive score on the case was lower than the selected threshold; hence the image was classified as “normal”. Note that the TB false positive image was saved in the system with inverted colors that were inconsistent with what was specified in the DICOM header tag, and presented to the model that way.

