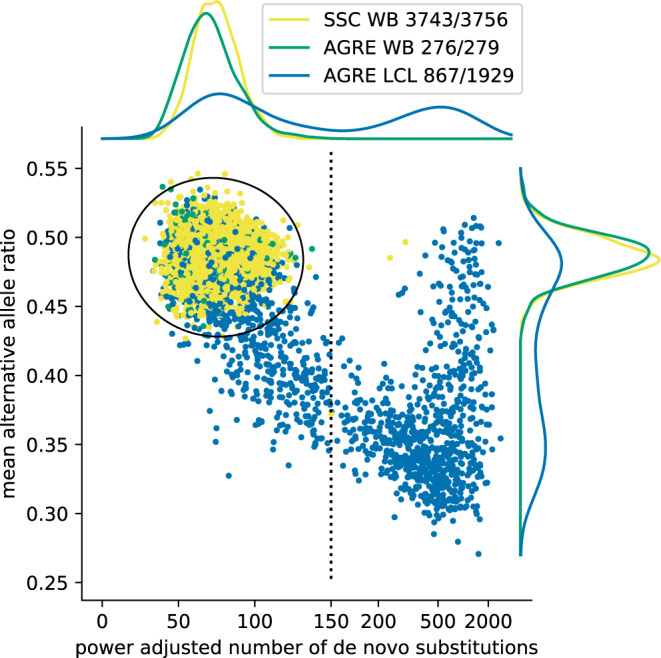
Fig. 1. Cell-line genetic drift filter.

Each dot represents a data point from one individual child. Individuals from AGRE for which DNA was extracted from LCLs (AGRE LCL) are colored blue, individuals from SSC, for all of which DNA was extracted from whole blood (SSC WB) are colored yellow, and individuals from AGRE extracted from whole-blood DNA (AGRE WB), are colored green. We adjusted the number of observed de novo substitutions based on the power for detection of de novo SNVs estimated separately for every child (see Materials and Methods for description of procedure for power estimation and Supplementary Figure 2). We set the adjusted number of de novo substitutions to the observed number of de novo substitutions divided by the estimated power and show it on the X-axis in linear scale for numbers smaller than 150 (the vertical dashed line) and in log-scale for larger numbers. For every child, we assigned the mean alternative allele ratio based on the alternative allele ratios (defined as the proportion of the sequencing reads converting the position that support the alternative allele) for each of the de novo substitutions identified in the child. The mean alternative allele ratios are shown on the Y-axis. Density plots in the top and right sides show marginal distributions of corresponding cohorts by color. We modeled the WB data from SSC and AGRE as a two-dimensional Gaussian distribution over the power adjusted number of de novo substitutions and the mean alternative allele ratio and we established an ellipse (shown in black) that would include 99.9% of the Gaussian distribution density. Children within the ellipse are considered free of cell-line genomic drift. We show in the inset the total number of children in each of the three groups together with the number of children that were determined to be free of cell-line genetic drift.
