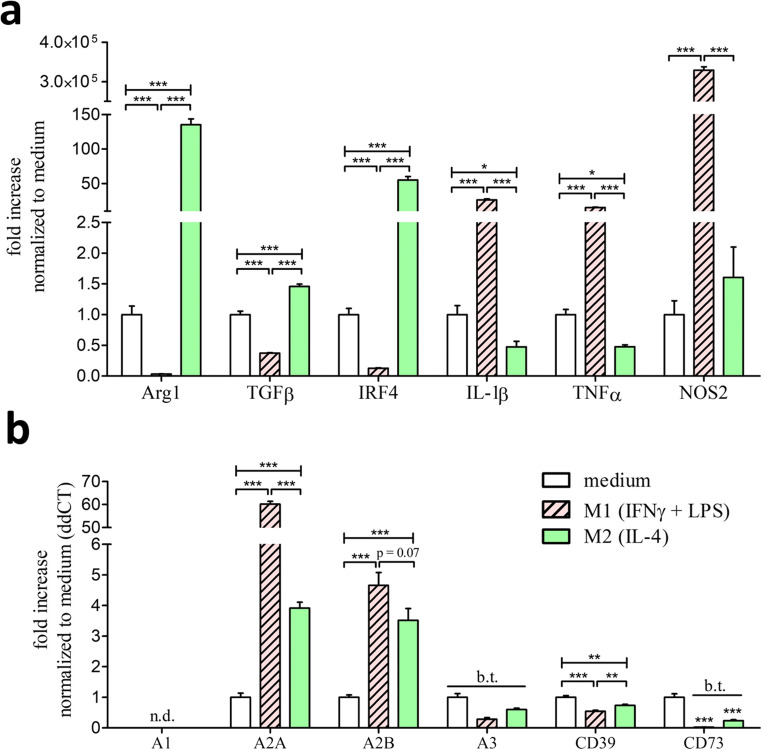
Fig. 2.
Expression of specific M1/M2 markers upon pro- and anti-inflammatory differentiation as well as P1 and ectonucleotidases in unstimulated M0 compared to differentiated M1 and M2 macrophages. a Real-time PCR detection described as ddCt fold increase of specific M1/M2 markers in BMDMs stimulated for 5 h with 10ng/ml IFNγ + 100 ng/ml LPS (red, striped bars) for M1 differentiation and 5 h with 20ng/ml IL-4 (green bars) for M2 differentiation. BMDMs which only received medium for 5 h (white bars) are described as M0 macrophages and serve as reference value for the ddCt fold increase comparison. b Real-time PCR expression described as ddCt fold increase referred to M0 expression (white bars) compared to M1 (red, striped bars)- and M2 (green bars)-differentiated macrophages. n.d., not detectable; b.t., below threshold; * p < 0.05, ** p < 0.01, *** p < 0.001

