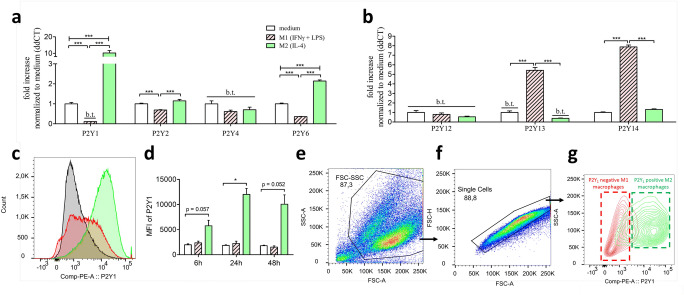
Fig. 4.
Metabotropic P2Y expression in M1-/M2-differentiated macrophages compared to unstimulated M0 macrophages. BMDMs stimulated for 5 h with 10ng/ml IFNγ + 100 ng/ml LPS are described as M1 (red, striped bars) and BMDMs simulated for 5 h with 20ng/ml IL-4 are described as M2 macrophages (green bars). BMDMs which only received medium for 5 h (white bars) are described as M0 macrophages. a Real-time PCR expression of Gq-coupled P2Y purinergic receptors (P2Y1, P2Y2, P2Y4, and P2Y6) in M1-/M2-differentiated macrophages described as ddCt fold increase referred to M0 expression levels. b Real-time PCR expression of Gi-coupled P2Y purinergic receptors (P2Y12, P2Y13, and P2Y14) in M1-/M2-differentiated macrophages described as ddCt fold increase referred to M0 expression levels. c Flow cytometric P2Y1-dependent histogram of 24h differentiated M0 (black-lined), M1 (red-lined), and M2 (green-lined) macrophages. d Quantification of the P2Y1-dependent mean-fluorescence intensity of M0, M1, and M2 macrophages after differentiation timepoints 6h, 24h, and 48h. e–g Gating strategy of P2Y1-dependent M1 and M2 distinction. e Debry-exclusion gating via cell size (FSC) and granularity (SSC). f Single cell gating via FSC-A (area) and FSC-H (height). g M1 and M2 distinction via the cell surface antigen P2Y1. b.t., below threshold; *** p < 0.001

