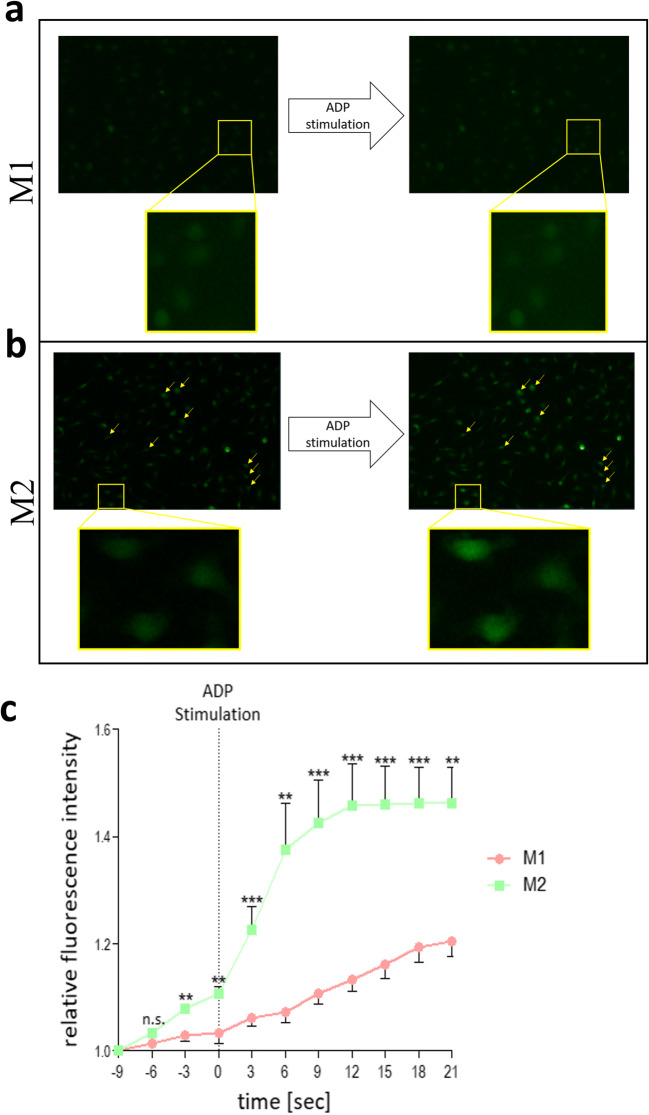
Fig. 5.
Calcium flux assay in M1 and M2 macrophages upon ADP stimulation. BMDMs stimulated for 5 h with 10ng/ml IFNγ + 100 ng/ml LPS are described as M1 (red dots) and BMDMs simulated for 5 h with 20ng/ml IL-4 are described as M2 macrophages (green dots). Representative pictures of M1 and M2 macrophages loaded with fluo-4 AM a prior and b after 200 mM ADP stimulation. c Quantification of fluo-4 AM fluorescence intensity over time upon 200 mM ADP stimulation in M1 (red dots) and M2 (green dots) macrophages

