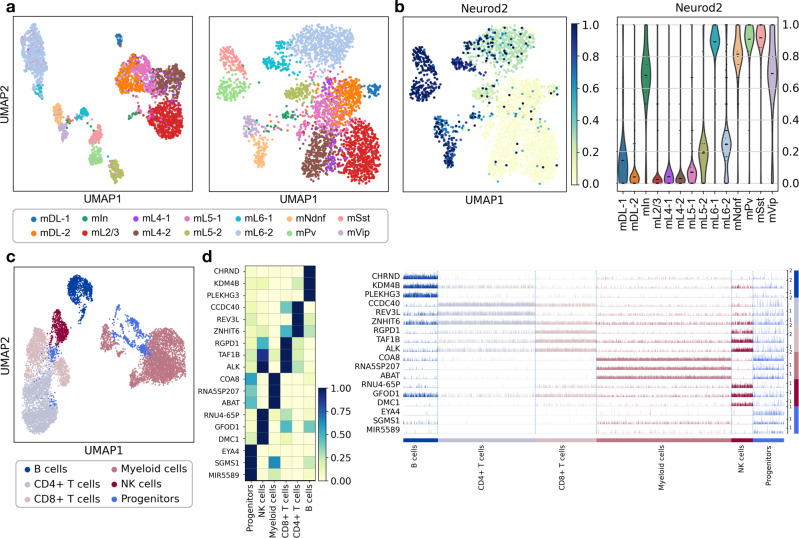
Fig. 2. Clustering, visualisation and cell-type annotation for single-cell DNA methylation data and scATAC-seq data.
a UMAP with annotated cell types for neurons from single-cell DNA methylation data from Luo et al.3, performed on the enhancer feature space (left, 3,288 cells x 54,932 enhancers) and promoter feature space (right, 3,224 cells x 32,610 promoters). Annotation: m mouse, DL deep layer, L layer, Ndnf neuron-derived neurotrophic factor, Pv parvalbumin, Sst somatostatin, Vip vasoactive intestinal peptide, In interneurons. b UMAP with methylation level at the Neurod2 promoter (a marker of inhibitory neurons) per cell (left) and violin plot with the distribution of Neurod2 promoter methylation per cluster (same colour code as in a). Excitatory neurons (mDL-1, mDL-2, mL2/3, mL4-1, mL4-2, mL5-1, mL5-2, mL6-1, mL6-2) have lower methylation at the Neurod2 promoter than inhibitory neurons (mNdnf, mPv, mSst, mVip, mIn). c UMAP with annotated cell types for PBMCs from scATAC-seq data from the 10x platform37, performed on the open chromatin peak feature space (9,891 cells x 75,226 peaks). d Heatmap and track plot indicating openness of the top differential open peaks and their associated genes, which are markers of B cells (CHRND, KDM4B and PLEKHG3, marked in dark blue), T cells (CCDC40, REV3L, ZNHIT6 for CD4+, marked in light grey and RGPD1, TAF1B and ALK for CD8+, marked in light pink), myeloid cells (COA8, RNA5SP207 and ABAT, marked in dark pink), NK cells (RNU4-65P, GFOD1 and DMC1, marked in burgundy) and hematopoietic progenitors (EYA4, SGMS1, and MIR5589, marked in blue). On the heatmap plot, the mean openness per cluster is indicated with a colour scale from 0 (closed) to 1 (open). On the track plot, the openness per cell inside of every cluster is plotted from 0 (closed) to 1 (open). These different cell type identification plots are shown here for DNA methylation (b) and ATAC-seq (d), but all plots are available for all modalities (Supplementary Figs. 7–9).

