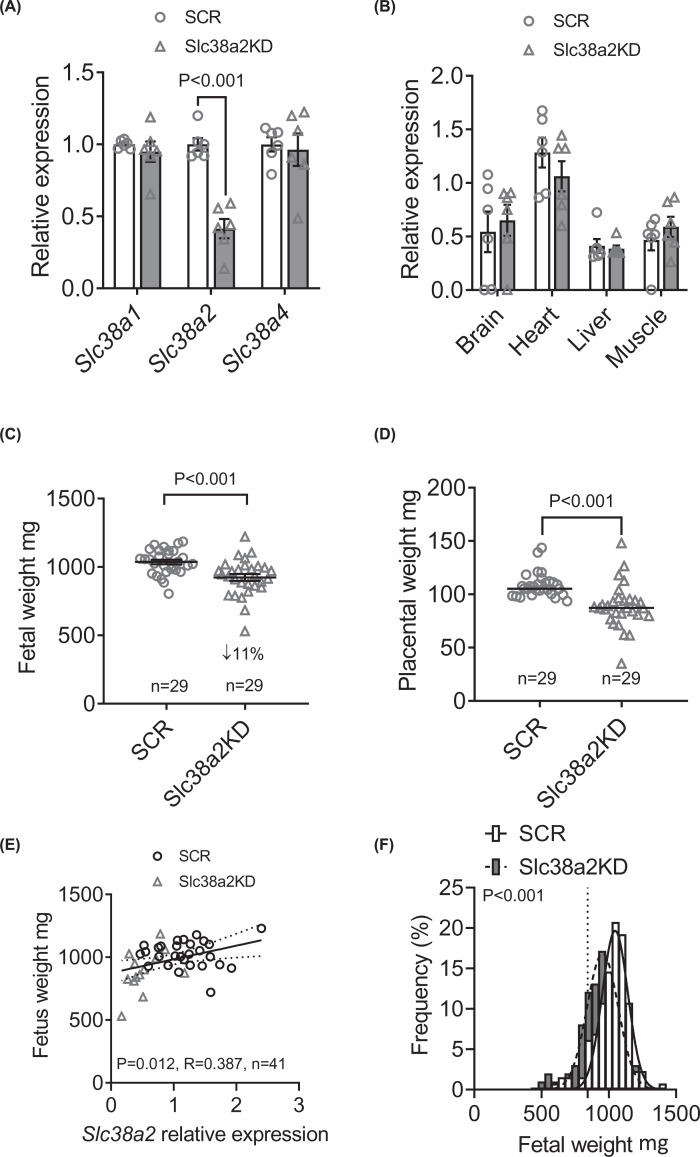
Figure 1. Placenta-specific Slc38a2 knockdown reduces placental and fetal weights at E18.5.
(A) Gene expression of Slc38a1, Slc38a2 and Slc38a4 in placentas of SCR and Slc38a2KD conceptuses, n=6 litters (28 SCR placentas, 13 Slc38a2KD placentas). (B) Slc38a2 expression in selected fetal tissues from SCR and Slc38a2 conceptuses, pooled from n=6 litters (27 SCR fetuses, 15 Slc38a2KD fetuses). (C) Fetal weight and (D) placental weight in SCR and Slc38a2KD conceptuses from n=29 litters (130 SCR conceptuses and 99 Slc38a2KD conceptuses). Points represent litter means. (A–D) Litter mean values for SCR and Slc38a2 compared by paired Student’s t test. P-values for statistically significant differences (P<0.05) given in figure. Mean ± SEM. (E) Correlation of fetal weight with placental Slc38a2 expression for individual SCR (n=28) and Slc38a2KD (n=13) conceptuses. Points represent individual conceptuses. Pearson correlation coefficient (R) and P-value given in figure. Linear regression line with 95% confidence intervals shown. (F) Frequency distribution of individual fetal weights in SCR (n=130) and Slc38a2KD conceptuses (n=99). Gaussian curves fitted by least-squares non-linear regression and compared by extra sum-of-squares F-test (P-value given in figure). Best-fit values for curves: SCR amplitude 18.7 ± 1.2%, mean 1034 ± 7 mg, SD 101 ± 7 mg; Slc38a2KD amplitude 17.2 ± 1.3%, mean 952 ± 10 mg, SD 113 ± 10 mg. Dotted vertical line indicates 10th percentile of SCR fetal weights.

