. 2021 Jul 22;21(4):e25. doi: 10.4110/in.2021.21.e25

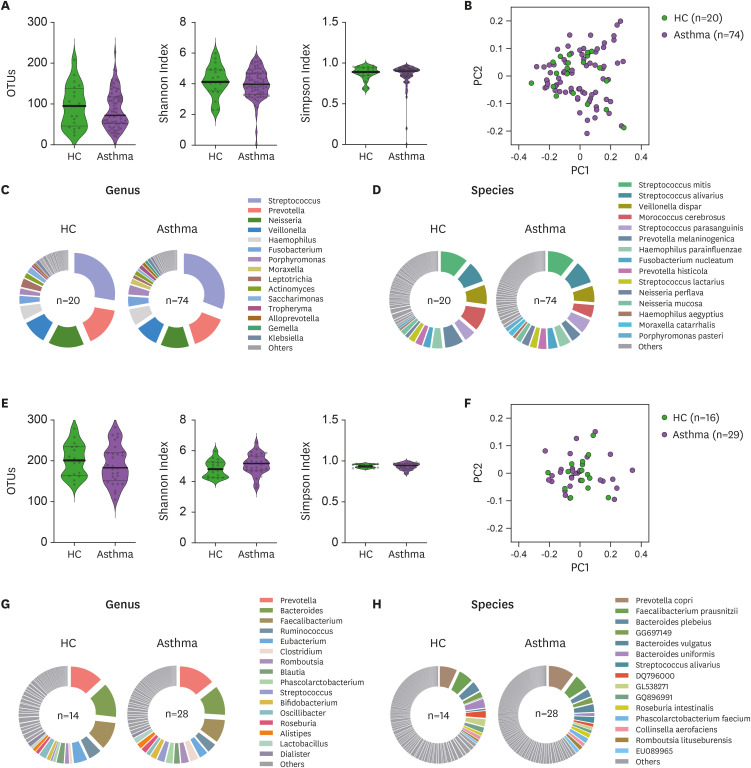
Figure 4. Microbiome diversity and abundance in the airway and gut of HC and asthma patients. (A) Sputum microbiome alpha-diversity in the HC (n=20) and asthma patients (n=74) was measured by counting the OTUs or using the Shannon and Simpson indices. (B) Sputum microbiome beta-diversity in the HC (n=20) and asthma patients (n=74) was measured by using the weighted normalized UniFrac distance matrix. (C, D) Phi-charts showing the relative microbial abundances in the sputum from HC (n=20) and asthma patients (n=74). The top 15 genera (C) and species (D) in the sputum microbiomes were shown. (E) Gut microbiome alpha-diversity in the HC (n=14) and asthma patients (n=28) was measured by counting the OTUs or using the Shannon and Simpson indices. (F) Gut microbiome beta-diversity in the HC (n=14) and asthma patients (n=28) was measured by using the weighted normalized UniFrac distance matrix. (G, H) Phi-charts showing the relative microbial abundances in the gut of HC (n=14) and asthma patients (n=28). The top 15 genera (G) and species (H) in the gut microbiomes were shown. The healthy control and asthma groups were compared in terms of alpha-diversity data (the OTU, Shannan index, and Simpson index data) by Mann-Whitney U test or unpaired t-tests. Each dot represents one human sample.

Figure 4