. 2021 Jul 22;21(4):e25. doi: 10.4110/in.2021.21.e25

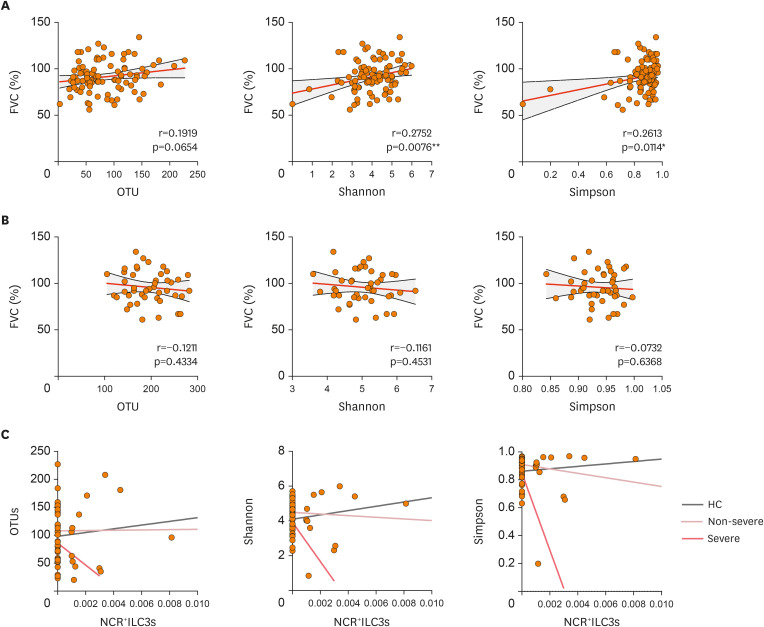
Figure 5. Correlations between microbiome diversity, sputum NCR+ILC3 frequencies, and asthma severity. (A, B) Correlations between FVC and microbial alpha-diversity in the sputum (A) or gut (B). (C) Correlations between sputum NCR+ILC3 frequencies and sputum microbial alpha-diversity in HC (gray linear regression line), non-severe asthma patients (pink), and severe asthma patients (red). The correlations between FVC and microbial alpha-diversity were determined with Pearson or Spearman r correlation tests depending on data normality. The correlations between sputum NCR+ILC3 frequencies and sputum microbiome alpha-diversity were determined with Pearson's r correlation test. Each dot represents one human sample.

Figure 5