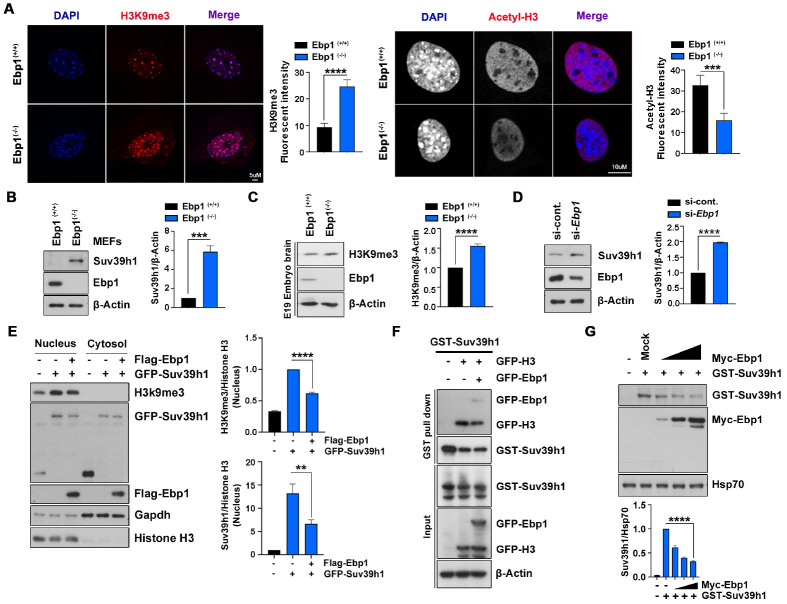
Fig. 1.
EBP1 regulates Suv39H1. (A) Ebp1(−/−) and Ebp1(+/+) MEFs were immunostained with H3K9 me3 (left) and acetyl-H3 (right) antibodies for heterochromatin and euchromatin respectively, and counterstained with DAPI. Each bar graph represents the level of H3K9 me3 and acetyl-H3. Scale bars = 5 μm (left) and 10 μm (right). (B) Ebp1(−/−) MEFs have increased levels of Suv39H1 protein. Endogenous protein levels were detected by immunoblotting as indicated. The bar graph shows Suv39H1 protein normalized to β-actin protein abundance. (C) Mouse embryos isolated at E19 from an Ebp1 knockout mouse. Ebp1(+/+) and Ebp1(−/−) embryo brains were used to compare levels of H3K9 me3. Endogenous levels of H3K9 me3 and EBP1 in brain lysates were detected with specific antibodies as indicated. (D) HEK293T cells were transfected using si-control and si-Ebp1 and immunoblotting was performed as indicated. The bar graph shows the quantification of Suv39H1 protein level. (E) Subcellular fractionation was performed using HEK293T cells transfected with GST-Suv39H1 and Flag-EBP1. Histone H3 and GAPDH antibodies for the nucleus and cytosol, respectively. The bar graphs indicate the levels of H3K9 me3 (upper) and GFP-Suv39H1 (lower) normalized to nuclear histone H3. (F) GST-Suv39H1 and GFP-tagged H3 and EBP1 plasmids were transfected to HEK293T cells and GST pull- down assay was performed. (G) HEK293T cells were transfected to GST-Suv39H1 and gradient Myc-EBP1. Immunoblots (upper) and bar graph (lower) show decreasing Suv39H1 protein level. **P < 0.01, ***P < 0.001, ****P < 0.0001. Images shown here are representative at least 3 independent experiments and values in these figures represent means ± SEM from more than 3 independent experiments.

