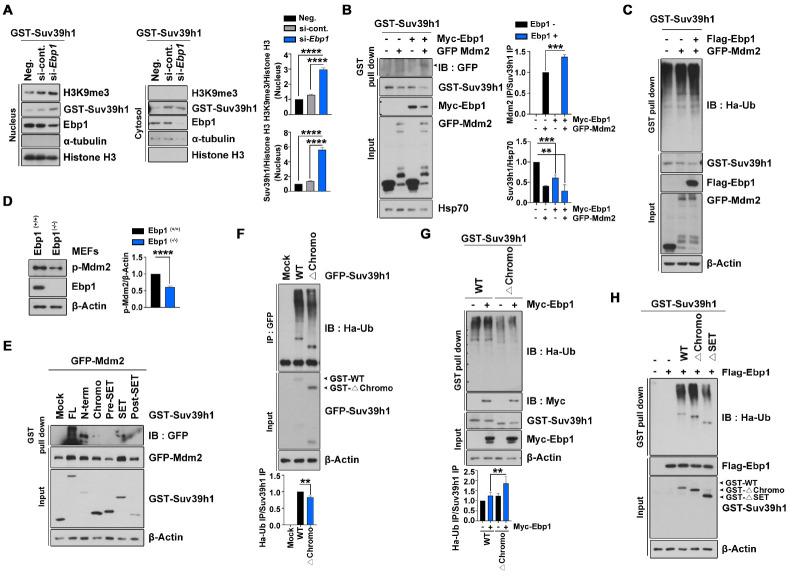
Fig. 4.
EBP1 enhances MDM2 activity on Suv39H1. (A) HEK293T cells were transfected with GST-Suv39H1, si-Ebp1, and control. After 48 h transfection, cells were lysed and subjected to subcellular fractionation. The nuclear fraction was normalized to histone H3 and the cytosolic fraction to α-tubulin abundance. The bar graphs show the level of nuclear H3K9 me3 (upper) and Suv39H1 (lower) protein. (B) HEK293T cells were transfected with the indicated plasmids. GST pull-down assay and immunobloting was performed as indicated. (C) GST-Suv39H1, Flag-EBP1, GFP-MDM2, and HA-Ub were used to transfect to HEK293T cells for 24 h, after which transfected cells were treated with 10 μM MG132 for 8 h. Cell lysates were used for GST pull-down assay. The level of Suv39H1 ubiquitination was confirmed with an anti-HA antibody. (D) Ebp1-expressing whole-body mouse E13.5 MEF cells were used to determine phospho-MDM2 (p-MDM2) protein level. The bar graph shows p-MDM2 abundance. (E) Indicated plasmids transfected to HEK293T cells and GST pull-down assay was performed. (F) GFP-Suv39H1 WT and Δchromo constructs were transfected to PC12 cells. Cells were then treated with 10 μM MG132 for 8 h and lysed for immunoprecipitation with an anti-GFP antibody. (G) PC12 cells were transfected by GST-Suv39H1 WT and Δchromo, Myc-EBP1, and HA-Ub plasmids. After treatment of 10 μM MG132 for 8 h, cells were lysed and used for GST pull-down assay. The level of ubiquitination was detected using an anti-HA antibody. The bar graph indicates the ubiquitination level of the Suv39H1 constructs normalized to that of the Suv39H1 pull-down control. (H) GST-Suv39H1 WT, Δchromo, and ΔSET constructs, as well as Flag-EBP1 and HA-Ub were transfected to PC12 cells. GST pull-down assay was performed and the HA-Ub blot shows the ubiquitination level of the Suv39H1 constructs in the presence of EBP1. **P < 0.01, ***P < 0.001, ****P < 0.0001. Images shown here are representative at least 3 independent experiments and values in these figures represent means ± SEM from more than 3 independent experiments.

