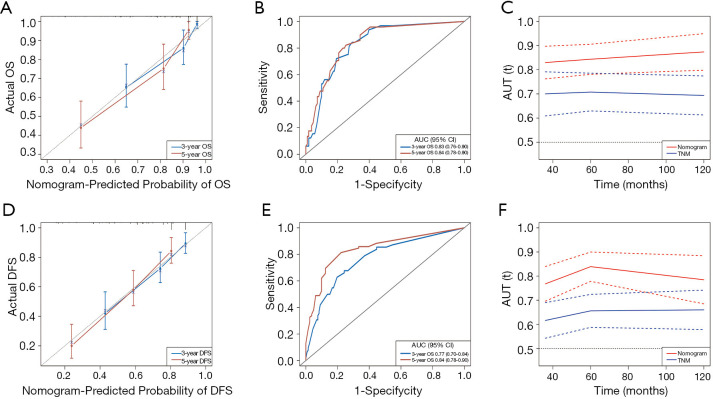
Figure 2.
Performance of the prognostic nomograms in the training cohort. Calibration curves of the OS nomogram (A) and the DFS nomogram (D); ROC curves and AUCs of the OS nomogram (B) and the DFS nomogram (E); time-dependent ROC curves compared the OS nomogram and the TNM model (C) as well as compared the DFS nomogram and the TNM model (F).

