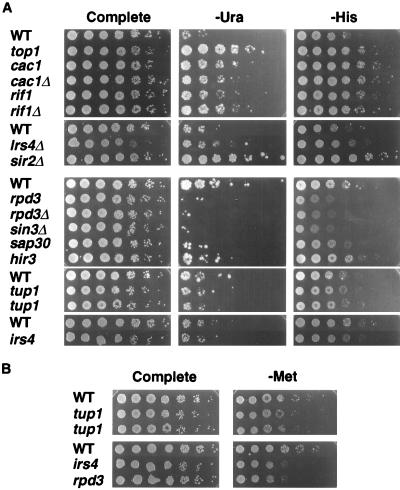
FIG. 2.
rDNA silencing phenotypes of selected mutants. (A) Quantitative growth assays measuring the silencing of mURA3 and HIS3 within the rDNA. Fivefold serial dilutions of freshly grown cells were plated onto either SC (Complete), SC−Ura (−Ura), or SC−His (−His) medium. Strains shown are WT (JS306 or JS311), top1 (M122), cac1 (M179), cac1Δ (JS400), rif1 (M158), rif1Δ (JS418), lrs4Δ (JS574), sir2Δ (JS576), rpd3 (M480), rpd3Δ (JS490), sin3Δ (JS493), sap30 (M475), hir3 (M489), tup1 (M419 and M432), and irs4 (M469). The photographs were taken for the SC−Ura plates at day 3 for the lrs mutant series (top of panel) and day 4 for the irs series (bottom of panel). (B) Quantitative growth assay measuring silencing of MET15 in NTS2. Fivefold serial dilutions of cells were plated onto SC and SC−Met −Cys medium. Strains were the same as for panel A.

